Archive | January, 2012

Trade News: Manufacturing Outlook in the U.S and China – Rhetoric & Reality

From Euromonitor: China Leads Global Manufacturing Output. In 2010, China was the world’s largest manufacturer and stands to maintain this in 2011. Low labour costs and economic growth have allowed China to become the destination of choice for global businesses looking for offshore manufacturing. Consumers have benefitted from the resulting competition for production costs. However, China’s one-child policy and rising wages are restricting manufacturing and labour growth, while the country has earned the unwanted tag as the world’s low-quality producer.

China’s total manufacturing production expanded by 107.9% in real terms over 2005-2010, amounting to US$10.2 trillion, the largest total worldwide, and more than double that of second-placed USA. The country’s large manufacturing base has been key in attracting foreign businesses and boosting the domestic labour market, while Chinese consumers have benefited from lower prices on locally produced goods. Nonetheless, high rates of inflation, growing wages and a shift in government policy are beginning to erode China’s manufacturing edge, with businesses increasingly turning to cheaper Asia Pacific producers. With manufacturing making up 29.5% of GDP in 2010, one of the highest ratios in the world, China remains vulnerable to external demand shocks.

However, China is losing its advantage as a low cost environment for labour. The country’s one-child policy is resulting in shortages of labour which permits workers the leverage to demand better wages. Rapid population aging is narrowing the labour pool, while high inflation is increasing export and transportation costs. Wages per hour in manufacturing increased by 63.1% in real terms over 2005-2010.

From Tradeology (ITA): The Manufacturing Council: A Public/Private Sector Partnership for Progress.

Why is the manufacturing sector so important? Its because, historically, it has been a key to U.S. economic growth, provided a ticket to the middle-class for American workers, and been home to some of America’s greatest innovations.  Looking ahead, as Secretary Bryson recently told the U.S. Chamber of Commerce, “without a strong manufacturing base, we can’t create enough good jobs to sustain a strong middle class. And without a strong middle class, we cannot be a strong country.”  334,000 manufacturing jobs have been created over the last two years.  In the third quarter of 2011, manufacturing profits were up more than 7 percent compared to the first quarter.

ITA is committed to keeping this momentum going in a variety of ways including helping U.S. manufacturers reach new markets.

  • Only 1 percent of U.S. businesses export. Of those that do, 58 percent export to only one market. There is potential for U.S. manufacturers to do so much more.
  • With efforts like the New Market Exporter Initiative, ITA is working with private sector partners — like the National Association of Manufacturers— to provide U.S. businesses with the support they need to reach new markets and new customers.

U.S. Import Shipping News: From Data Providers Datamyne, Panjiva and PIERS

From Datamyne: Looking for Cool. Top product searches of import data focus on refrigerants. The most frequent product search of Datamyne’s US import data in December was for R134a (a.k.a. hydrofluorocarbon-134A, or HFC-134a, or 1,1,1,2–tetrafluoroethane), a refrigerant used in most car air conditioning units … until now.  In 2006, the European Union set 2011 as the deadline for phasing out R134A in new model cars. All new cars must use an alternative by 2017. This is because R134a’s global warming potential (GWP) is 1430 (1430 times the heat-trapping power of the same amount of carbon dioxide). The EU’s new limit is <150 GWP.

One potential replacement, endorsed by SAE International, the global association of technical experts in the aerospace, automotive and commercial-vehicle industries, is HFO-1234yf (or 2,3,3,3-tetrafluoroprop-1-ene), which  has a GWP of 4. Chemicals companies are jockeying for position in what could be the auto AC refrigerant of global choice. Interestingly, another alternative – R152a – was among Datamyne’s top 10 product searches in September, October and November (when it was number 1).

From Panjiva, courtesy of Libby Fortier, Version 2.0 Communications: December Trade Data: Seasonal Declines After The Holidays. Trade activity experienced a noticeable seasonal decline from November to December. Specifically, the number of waterborne shipments coming into the U.S. experienced a 7% month-over-month decrease from November to December. November-to-December changes have varied widely in recent years: -14% in 2010, +3% in 2009, -8% in 2008, and -3% in 2007.  The number of global manufacturers shipping to the U.S. dipped 4% from November to December. November-to-December changes in previous years: -9% in 2010, +3% in 2009, -5% in 2008, and -1% in 2007.

From PIERS:  U.S. Containerized Imports Grow 5% in November. U.S. containerized import volume rose 5% Y-o-Y in November, a sharp turnaround in the slumping market that was pushed by strong gains in shipments tied to the recovering housing industry, reported Mario O. Moreno, economist for PIERS/The Journal of Commerce.

Increases in home sales have buoyed the housing market, leading to a 7% November growth in shipments of furniture, a top import commodity.

“A healthy housing market is key to the revival of U.S. containerized imports growth as many of the goods consumers purchase to furnish a home are imported,” Moreno said. He pointed to additional expansion in November in cooking and heat appliances, lamps and parts, and kitchenware. Growth in these other commodities contributed to the increase in imports from China—up 4.1% Y-o-Y, the country’s first rise in eight months. Demand for local lumber was a key factor in a surprising November increase of 515% in imports from Canada.

“The question is, are we seeing a self-sustained recovery in home sales?” Moreno said. “This will depend very much on how many jobs the economy can generate every month… Over the last 12 months through November, the economy generated an average of 132,000 jobs per month (NSA). We are not there yet, but getting closer.”

Trade Trends from Euromonitor: Consumer Electronics, Holiday Spending & Multi-Vitamins

Regional Spotlight: Vietnam, Indonesia and Philippines. Much of consumer electronics (CE) manufacturers’ attention on Asia Pacific is centered on China and India. In this article, Euromonitor International casts its eyes on the often overlooked countries like Vietnam, Indonesia and Philippines (VIPs) and assesses their potential to CE manufacturers.

As Western Europe and the U.S. are embroiled in economic woes, manufacturers are banking on Asia Pacific, notably China and India, as a catalyst for growth. The vast territory of Asia Pacific offers hidden gems for manufacturers and retailers, with consumers from Vietnam, Indonesia and Philippines also having the economic might to purchase electronic devices.

Consumer Electronics Global Overview: Growth Trends and Analysis. Consumer electronics sales rebounded from the global economic downturn in 2009 and showed strong and steady growth in 2010. The key growth driver is consumers’ insatiable appetite for connectivity – internet and mobile.

The Year of the Fiery or Subdued Dragon? Lunar New Year and Consumers.  Asian consumers, particularly, like to travel during the Lunar New Year due to the long holiday period they get from work. The package tour is a perennial favourite. However, the emphasis on sightseeing is diminishing to give way to shopping time.  Trends in festive snacks come and go, but among those that have stood the test of time are roasted nuts, especially cashews and pistachios (due to the representation of smiley faces) and candies (sweet is synonymous with happiness).  The chart below depicts holiday spending trends in China and Taiwan.

The Power of Multivitamins to Prevent Diseases. Fears of getting sick benefit multivitamin sales in some countries.  See the chart below.

Trade News: Euromonitor’s International’s Top 100 City Destinations Ranking

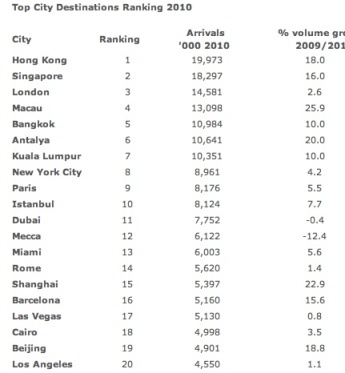
Euromonitor International’s Top 100 City Destinations Ranking. Euromonitor International is pleased to release its latest Top City Destinations Ranking, covering 100 of the world’s leading and most dynamic cities in terms of international tourist arrivals. After recording a decline in 2009, international arrivals to countries regained growth in 2010, positively impacting results for the top 100 cities, which saw arrivals increase by 7%. Star performers in 2010 were emerging city destinations located in Asia Pacific, thanks to a strong economic environment and growing travel and tourism dynamism. Most European cities lagged behind as a result of the weak economic prospects in the Eurozone, which impacted intra-regional travel.

Top three destinations

In 2010, Hong Kong, Singapore and London were the most popular city destinations worldwide. Hong Kong topped the ranking with almost 20 million arrivals in 2010 and an outstanding 18% increase compared to 2009. The booming economy of Hong Kong coupled with its growing appeal as a travel and tourism destination is drawing more business and leisure travellers each year. In 2010, mainland China remained the largest source market for Hong Kong, accounting for approximately 60% of arrivals.

Singapore was the second most visited city, attracting 18 million tourists in 2010 – 16% more than in 2009. The Singapore Tourism Board launched a 3-pronged approach – Innovation, Integration and Productivity – in 2010 that focused on luxury travel as well as the further consolidation of MICE, travel accommodation and tourist attractions throughout the city. The opening of new tourist attractions like the Marina Sands Resort Sky Deck, new casinos operated by the Las Vegas Sands Corp and by Malaysian-owned Resorts World Sentosa, new shopping centres like the Orchard Central, the Universal Studios Singapore and the Helix Bridge helped bring international visitors to the city.

London closely followed Hong Kong and Singapore in third position, with 15 million arrivals in 2010. London is by far the most popular city in Europe, benefiting from a wide mix of entertainment options, including historical sites, art galleries and restaurants, which make it highly appealing for all kind of visitors. Nevertheless, the city is under pressure, having recorded a sluggish 3% growth in 2010 in the face of increased competition from other destinations like Hong Kong and New York City.

Trade News from Euormonitor: Turbulent Times for Global Manufacturing

From Euromonitor: Special Report: Turbulent Times for Global Manufacturing. The global manufacturing sector is becoming accustomed to volatile market conditions, a result of wild swings in demand and commodity prices over 2005-2011. Having overcome the global economic downturn of 2008-2009, manufacturing continues to face a number of challenges. While the global shift in production presents strong opportunities for savvy businesses, traditional consumer markets are forcing out manufacturing industries to more cost-effective locations.


Key Points:

  • Manufacturing is a key component of global industry, responsible for a large share of employment and investment, with its fortunes directly linked to consumer confidence. In 2010, total global manufacturing production made up 57.0% of the world’s total GDP.
  • The impact of the global economic downturn of 2008-2009 sent global manufacturing production tumbling, with world output falling by 12.5% annually in real terms in 2009 as consumers toned down their expenditure and demand plummeted. However, over 2005-2010, real global manufacturing output actually expanded by over a fifth.
  • Although all regions saw a real annual fall in manufacturing production in 2009, Eastern Europe was particularly hard-hit, with its manufacturing as a percentage of total GDP falling from 17.0% in 2008 to 15.7% in 2009. By contrast, Asia Pacific’s manufacturing sector rode out the global economic downturn relatively well.
  • 2010 saw a solid recovery in manufacturing as the global economy improved, with annual world real GDP growth reaching a healthy 5.2%. The great manufacturing shift from advanced to developing economies continues unabated, with China leading world total manufacturing production in 2010. Consumers, meanwhile, have benefitted from market diversification, greater competition and a wider array of low-cost goods and services.
  • However, a series of fiscal and supply-chain shocks over 2011 have brought greater volatility to commodity prices and consumer demand, resulting in a dampened, albeit still positive, forecast annual global manufacturing growth in 2011. The outlook in Western Europe is especially fragile, although economic tremors can spread globally should the eurozone debt crisis worsen.

Prospects

Total global manufacturing production is expected to expand by 7.7% in real terms in 2011 annually. Most of this growth will come from Latin American and Asia Pacific, although Western Europe is expected to improve on its 2010 manufacturing output. However, with a number of Western European nations languishing well below 100.0 in the Manufacturing Production Index (1995=100) in 2010, the macroeconomic and manufacturing shift from advanced economies to emerging markets will likely continue. As a result of Arab Spring disruptions across 2011, Middle East and North Africa are projected to see greatly reduced manufacturing capacity in the short term.

Notable manufacturing strategies have been implemented in both Brazil and China. Brazil’s government launched the “Bigger Brazil” plan in August 2011, which is set to enhance the business environment for manufacturing businesses through subsidies and tax cuts. China’s 12th Five-Year Plan (2011-2015), announced in March 2011, focuses on developing sustainable, high-tech manufacturing industries while downgrading its low-quality goods production, with potentially long-reaching consequences for global exports. This may provide opportunities for other emerging nations to take over China’s mantle as a major cheap goods producer in the long run.

Trade News: On the Global Corruption Index by Transparency International & Euromonitor

A report by Transparency International (The Global Coalition Against Corruption) says Britain has dropped in the league table of countries perceived to be cleanest in world.  Read the article in the Guardian. An Interactive map displaying global corruption is available at the Transparency web site. There is also a different version on global development available from The Guardian web site.  This effort is supported by the Bill and Melinda Gates foundation. You can view a larger size of the corruption listing by clicking on the list below.

From Euromonitor: Special Report: The Impact of Corruption.  The global level of corruption, which includes bribery, fraud and embezzlement, is impossible to quantify but appears to be increasing in 2011. Corrupt practices affect all countries, though are most obvious and pervasive in developing countries, with war-torn and unstable states the worst-affected. Governments and international bodies are making efforts to fight the problem, but corruption will continue to impact businesses and consumers both in developed and developing countries.


Economic impact

Corruption has a huge impact on the economy and business environment:

  • By increasing the size of the ‘grey’ or informal economy, corruption reduces government revenue because many transactions remain outside the formal taxation system. In 2010, the Kenyan government said it estimated that up to one-third of its national budget was being lost to corruption every year.
  • Systems of nepotism and bribery often place unqualified officials in charge of decision-making on public sector spending and policy. This leads to mismanagement and further opportunities for the system to perpetuate itself. Commodity-rich countries in developing regions are also more susceptible to corruption due to a combination of significant state wealth combined with often poor standards of governance and legislation.
  • Corruption can discourage foreign investors because it affects the efficiency and competitiveness of the business environment. However, there is no direct correlation between the two: Russia received US$38.7 billion in Foreign Direct Investment (FDI) inflows in 2009 even though it was rated 154th out of 178 countries in the CPI in 2010, while Nigeria received the highest FDI in sub-Saharan Africa in 2009 at US$5.9 billion, but is rated 134th on the CPI.
  • Many foreign companies are prepared to risk engaging in corrupt practices in developing countries (especially those rich in natural resources) given the financial rewards involved.

An updated version of the Corruption Index (for 2011) is available from Euromonitor.

Trade News: U.S. Competitiveness Throughout the 20th Century and Beyond

From U.S. DOC: A Timeline of Out Compete-ing. The 20th century was a period of extraordinary performance in the United States. Americans were living longer and more fruitful lives. They were better-educated than past generations and residents of other countries. The United States was out-innovating, out-educating, out-connecting, and out-producing the rest of the world, assisted by ground-breaking research and federal funding. Life expectancy was higher than it had ever been, more than 70 percent of teenagers were enrolled in secondary education, and in 1986 the United States comprised 25.2 percent of the world’s economy.

50 years later, these innovations are still major parts of American lives. The 21st Century has seen huge surges in information infrastructure. As the capacity and usage of the Internet began to grow in the 1990s, the need for better interfaces for sifting through all the information led to early search engines like Yahoo! and later Google, Inc. who are both supported by National Science Foundation (NSF) grants.

The turn of the century also witnessed incredible advances in medicine and science. In 2003, the Human Genome Project consortium released the sequence of the human genome, and the knowledge this consortium provides will revolutionize diagnoses, treatment, and hopefully even prevention in the of number of diseases.

Also from DOC: Commerce Department Releases COMPETES Report: A Roadmap for Strengthening U.S. Competitiveness.  The U.S Department of Commerce today delivered to Congress a comprehensive report on “The Competitiveness and Innovative Capacity of the United States.”  The report makes three important findings:

  • Federal investments in research, education and infrastructure were critical building blocks for American economic competitiveness, business expansion and job creation in the last century;
  • Failures to properly invest in, and have comprehensive strategies for, those areas have eroded America’s competitive position; and,
  • In a constrained budgetary environment, prioritizing support for these pillars are imperative for America’s economic future and provide a strong return on investment for the U.S. taxpayer.

The full report, as well as additional resources, can be found online at www.commerce.gov/competes.

Trade News from PIERS & Datamyne Blogs: Money Laundering & New BRICS

From Datamyne: More Bank Accounts Seized.  This past year has seen an explosion of seizures of bank accounts by the Drug Enforcement Administration (DEA) and the US Immigration and Customs Enforcement (ICE) or Homeland Security Investigations (HSI) for alleged trade-based money laundering or “structuring.”  Structuring is the deposit of $10,000 or less in cash repeatedly in a bank account to avoid the filing by the bank of a Currency Transaction Report (CTR) with the Financial Crimes Enforcement Network (FinCen), US Department of the Treasury. [See 31 CFR 1010.314.]

A CTR is required to be filed by all banks whenever a deposit of cash over $10,000 is made in a single day into a single account, or by a customer into different accounts. Be aware that deposits of cash into multiple branches of a bank or in multiple transactions are still considered structuring. [See 31 CFR 1010.313.] When a bank suspects that its depositor or customer is making deposits of $10,000 or less to avoid the requirement that the bank file a CTR, the bank will often file instead a Suspicious Activity Report (SAR). SAR reports are analyzed by FinCen, and often referred to the DEA or ICE for investigation.

From PIERS: Finding the Next BRICs.  The coining of the acronym BRIC (Brazil, Russia, India, and China) by Goldman Sachs in 2001 has brought considerable prominence to these growing global powerhouses.  With the possible exception of Russia, these countries have been extraordinary success stories in global trade over the last decade.  In an attempt to emulate the success of the BRIC moniker, Goldman Sachs has introduced the Next Eleven (N11), while HSBC’s list uses the acronym CIVETS (Columbia, Indonesia, Vietnam, Egypt, Turkey, and South Africa).  Fidelity has chosen a similar acronym MINTs (Mexico, Indonesia, Nigeria, and Turkey), and Citi has created their Global Growth Generators, or 3G countries.

There are three factors that seem to be the underlying prerequisites for explosive global growth: a stable sociopolitical environment, human capital, and infrastructure. The only country that was selected by all four institutions was Indonesia, followed by Nigeria, Vietnam, Turkey, and Egypt which were included in three of the four analyses.  Other countries mentioned more than once include Bangladesh, Mexico, and the Philippines.