Archive | July, 2012

WorldTradeDaily.com is Seeking Commercial Sponsor and University Partner for WTD 2.0

In the last two articles, “WorldTradeDaily.com Concludes First Year of Publication with Launch of WTD 2.0” and  “WTD 2.0 Coming July 1, 2012 Will Focus on $2 Trillion of U.S. Import Trade Flows” we have outlined our intentions of launching a revised focus for the WorldTradeDaily.com website.

As initial preparation for this project, I have put together next year’s “cheat sheet” highlighting our planned product categories.  With some difficulty, I have combined U.S. Imports (by 2 & 4 digit product category) for the last 10 years – 2002 through 2011 with other data on U.S. imports.

  • U.S. Imports for each chapter & product group by each of the 25 leading U.S. trading partners
  • U.S. Imports for each chapter & product group by each U.S. State
  • U.S. Imports for each chapter & product group through each U.S Port District
  • U.S Imports for each chapter & product group by various methods of transport: water, air and ground (rail/truck).

This comprehensive, if complex portrait of U.S. Import Trade is available for download via our Google Docs site.  I would welcome your feedback.

Consolidated Spread Sheet Portraying Various Aspects of U.S. Import Trade Flows

The scope, detail and depth by which we can address this objective will largely be determined by the previously mentioned support and participation of an appropriate commercial sponsor and University partner.  It takes money and people.  There is a lot of in-depth research and prep work to do for each article, particularly if we produce and edit a videotaped version of each article.  Story development, writing, editing, graphics, site administration and marketing for a daily online publication require a considerable amount of time, persistence and elbow grease.  If we include video, there are many more considerations involving pre-production, production and post-production operations.  Thus the need for assistance.

Specifically, we would like to raise a minimum supplemental annual budget of $65,000 to cover operations, out-of-pocket expenses, and needed personnel from a commercial sponsor.  In addition, we are seeking an overall commitment of 100 -200 hours per month (collectively) from a handful of student interns via our University partner.  What’s in it for the respective sponsor and partner?

For the commercial sponsor – whether data vendor, information publisher, trade service provider or business-to-business international trade matchmaking forum – underwriting this endeavor would provide a valuable enhancement to their current marketing and promotional strategy.  It could also be a boon to their clientele.  For the University partner, it would provide valuable, practical experience for their business students who are interesting in pursuing a career within the international trade field.  In addition, it could improve market visibility.

Additional “perks” for both the partnering University and Sponsor will be:

  • Graphically appealing, tasteful attribution (promotion) on the WorldTradeDaily.com website, all published articles and distributed (downloaded) informational materials.
  • Complimentary use of the powerful trade intelligence applications Stats Plus and Prospects, originally developed by CenTradeX, then acquired and now marketed by UBM Global Trade /PIERS.  We maintain distribution /usage rights to a 13 licenses of each of the above applications through June 30, 2015.
  • Development of a dynamic collaborative partnership which has the potential of generating significant commercial and educational dividends on an ongoing basis.
  • Proprietary republishing rights of WorldTradeDaily.com content… whether utilized for education, promotion or otherwise.

San Diego: Economy, Port, Exports, and Companies

This report covers export data for San Diego and the Port of San Diego. General stats of San Diego’s exports are documented. The report has a data set available on all 1,000 exporting companies in San Diego. We conclude with a table of prominent companies that includes estimated value, export percentage, and commodity description.

San Diego

San Diego is the eighth largest city in the United States and second largest in California. Its metropolitan statistical area is home to over three million people. San Diego’s economy is based on defense/military, tourism, international trade, and research/ manufacturing in descending order. Click here for list of companies headquartered in San Diego.

Because of San Diego’s natural deep-water harbor, it is home to the largest naval fleet in the world. Tourism is huge because of the beaches, pleasant climate, and attractions. San Diego shares a 15-mile border with Mexico and therefore is home to many maquiladora engaged companies and commercial border crossings. Maquiladora literally means “twin plants,” one in the U.S and one in Mexico. San Diego encourages this process for US companies. Click here for the general process on how a company becomes Maquiladora.

Port of San Diego 

The Port of San Diego brings in nearly three million metric tones of cargo per year.  Due to a 20-year lease with Dole Food Company, it brings in much of the Nation’s banana crop. It was ranked by Bureau of Transportation Statistics as the 27th U.S. port in 2009 by container ship.

San Diego Exports

The estimated export value of San Diego’s MSA was 16 billion in 2010. These exports made up 9.3% of the area’s GDP and supported 65,000 direct export-production jobs. A total of 113,400 jobs were export-supported in 2010, ranking it 18th in the Untied States. This data was available from Brookings Export Nation 2012.

Brookings Export Nation 2012 San Diego

San Diego Exporting Companies

We have a complete data set of the exporting and importing companies in the San Diego MSA. There are 1,041 exporting companies in this area.

Below is a table with fourteen of the main companies. In the first column is the company. Solar Turbines is a part of the parent company Caterpillar Inc. Export value is listed in the second column. The third column documents percentage of shipments that are export vs. imports. The final column displays the primary export product for each company. Individual company trade data is available per request. For the excel list of all importing and exporting companies in San Diego, click here.

U.S. Imports of Honey from Argentina: Glorybee Natural Sweetener’s Honey Imports by Origin and Value

This report covers U.S. imports of honey, HS: 0409, from Argentina. We position Argentina as a source for imported honey. We then list United States companies buying and importing this honey. We conclude with a look at Glorybee Natural Sweetener’s  imported honey by value and country of origin. Glorybee’s 2011 bills of lading are available for download for those who are curious.

Untied States Imports of Honey: Argentina 

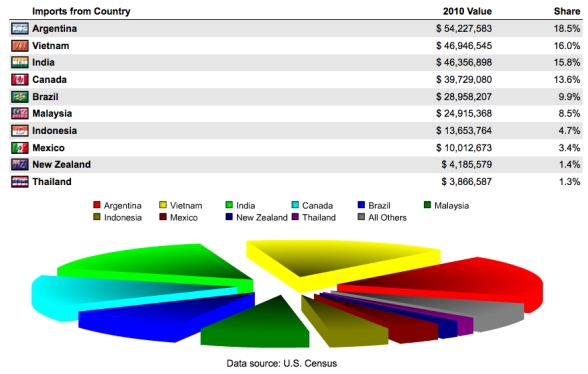
The United States is the world’s second largest importer of foreign honey in the world (see world honey report). Argentina is the largest supplier of foreign honey to the United States. In 2010 the United States spent 54 million dollars on honey from Argentina.

Below is a list of all the countries that the United States imports honey from with Argentina in the number one position.

United States Imports of Honey 2010, list by country, estimated value, and market share percentage with pie chart

U.S. Companies Buying Honey from Argentina 

Honey products can be used for a variety of products. Different grades are sold for different uses. The most pure honey is used for human consumption. Less pure honey is often used as flavoring for beauty products and drinks. If a country wanted to sell the Untied States honey, the first step would be to see who in America is buying it. With PIERS StatsPlus and Prospects we can find out exact companies buying honey from Argentina. Below is a list of all 13 United States companies buying and importing honey from Argentina.

Company

Web Address

Givaudan Fragrances Corporation www.givaudan.com/
Glorybee Natural Sweeteners Inc www.glorybee.com/
Wego Chemical And Mineral Corp www.wegochem.com
Rhe Hatco Inc  
Fotis And Son Imports Inc  
Cm Goettsche & Co Incorporated
Strahl & Pitsch Inc www.spwax.com
Pure Foods Inc
Impex Group www.impexgroup.com
Shannon Machine Co
Coin Wrap Inc www.coinwrap.com/
Gonzalez And Tapanes Foods Inc La Le Foods
Strohmeyer & Arpe Company Inc www.strohmeyer.com

Glorybee Natural Sweeteners Inc Honey Imports

To get a further glimpse into a specific company’s honey imports from Argentina, we get more data on Glorybee Natural Sweeteners. Glorybee brings Americans sweeteners, dried fruits, nuts, oils, and mainly, honey. Since we know that this company is importing Argentinean honey, we can look at the company profile available on PIERS Prospects to find how much honey they are buying.

We have access to the last year’s worth of Glorybee Natural Sweeteners Inc bills of lading (available here). Using this dataset we find out shipments by value of honey that Glorybee brought to the United States and from where. Although Glorybee does import Argentinean honey, they much prefer United Kingdom honey, honey from the Netherlands,Vietnam and India. Below is a custom-made bar chart representing Glorybee’s imports of honey in 2011 by overall value and country of origin. We can see that although Glorybee imports 2.5 million dollars of honey every year, only 85,000 dollars worth come from Argentina. This type of analysis is available for virtually any shipped product coming to the United States from any company.

Glorybee Natural Sweeteners Inc honey imports for 2011 by value and country of origin. Glorybee imports honey from the United Kingdom, Netherlands, Vietnam, India, and Argentina

Honey: World Production, Top Exporters, Top Importers, and United States Imports by Country

This report covers specifically the product Honey, HS: 0409. We report production of honey by country with a bar chart. We rank the world’s top exporters and the world’s top importers. We conclude with United States imports of honey by foreign country.

Honey Production by Country

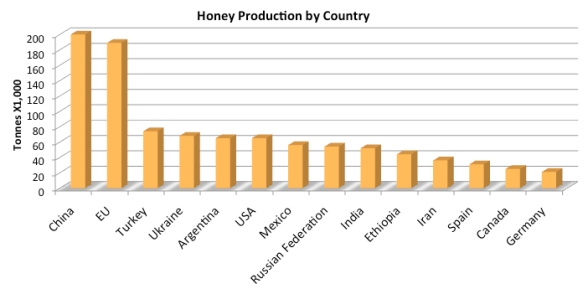
Honey, HS 0409, is a naturally produced sweet gathered and used by man for the last 8000 years. There are many different grades of honey available. Natural grade is different from industrial. Every batch of honey is special, even when from a similar region bees gather nectar from a wide variety of plants, producing distinct tastes. For the purpose of this report we lump all grades together under the HS code of 0409. Below is a bar graph of the world’s top honey producers by country and amount. The data is available at http://faostat.fao.org/site/339/default.aspx. Countries vary by year available. Check website for more specifics.

World Honey Production by Country and Tonnage

World Honey Exporters

With PIERS StatsPlus we can look at honey exports and imports. Following the production trends, China was the number one honey exporter in the world, selling 284 million dollars worth in 2009. China dominated 12% of the global honey sales. Germany was the second largest exporter followed by Mexico. Exported Mexican honey accounted for 7% of the total market. Below is a list of countries exporting by value with a pie chart.

World Exporters of Honey by Country, Market Value, and Estimated Value

World Honey Importers 

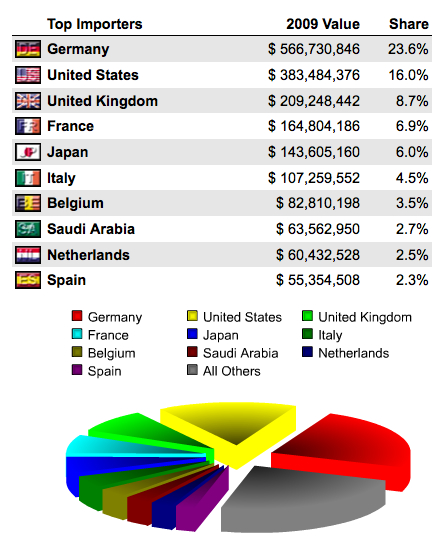
Germany was the number one honey importer in 2009. They imported almost a quarter of the available honey, 24%. United States was the world’s second largest honey importer, importing 16% of the market share at an estimated value of 383 million dollars. The United Kingdom was third, France was fourth, and Japan was the fifth. Below is a list of the top ten countries importing honey in the world with estimated value and market share.

World’s Top Importers of Honey by Country, Market Value, and Estimated Value

United States Imports of Honey

While the United States is one of the world’s largest producers of honey, they are also the second largest importer. They buy more honey than the largest exporter of honey sells.  The United States has a unique and diversified honey import profile. The United States imports 19% of their foreign honey from Argentina, spending an estimated value of 54 million dollars in 2010. Vietnam was the second largest source, accounting for 16% of U.S. bought foreign honey in 2010. The U.S. spent an estimated 47 million dollars on Vietnamese honey in 2010. India was the third largest source and Canada was the fourth. Below is a list of the top ten counties that Untied States is buying honey from.

United States Imports of Honey 2010, list by country, estimated value, and market share percentage with pie chart 

Atlanta Exports: Value, Product Categories, and Companies

This report covers Atlanta Metropolitan Statistical Area’s Exports. First we show Atlanta’s total export value, followed major products. To conclude, we list specific companies in the Atlanta area by export value, offering a comprehensive dataset of all 3000 Atlanta companies.

Atlanta’s MSA and Companies

Atlanta is considered New York City of the South. The metropolitan area is home to more than 5 million people, making it the ninth largest in the country. Metro Atlanta contains the third largest concentration of Fortune 500 companies, hosting the world headquarters of Coca-Cola Company, Turner Broadcasting, Home Depot, AT&T Mobility, UPS, Delta Air Lines, and Rubbermaid. Over 75% of the Fortune 1000 companies have a presence in the Atlanta area.

Total Export Value 

Atlanta had a 20 billion dollar export value in 2010, ranking it 13th in the nation. Exports made up 8% of this metro’s GDP, supporting an estimated 88,000 jobs through production and 150,000 though exporting as a whole. Export value grew 11% from 2009 to 2010. This data and graphic is from Brooking Export Nation’s 2012 report on the Atlanta MSA.

Brookings Export Nation 2012 report, Atlanta-Sandy Springs-Marietta GA. Export value 2010, share of GDP, and number of export related jobs

Atlanta Export Value by Umbrella Product Description

Atlanta’s exports are almost evenly distributed. Enough diverse companies are present in the Atlanta area that one market does not overtly dominate the Atlanta area’s exports. 18% of exports can be labeled under transportation equipment, 15% under computer and electronic products, 15% under machinery, and 12% as chemical products. Below is a pie chart displaying the major NAICS product categories of Atlanta exports. The data was made available to the public by the U.S. Department of Commerce.

Pie chart and list of Atlanta Metropolitan Area Exports by NAICS product categories

Atalanta Export Value by Company

Using PIERS Prospects we can get a comprehensive data-set of exporting companies. There are more than 3,000 companies in the Atlanta area. 1,000 of these companies are actively exporting goods. Click here to view/download spread sheet containing all companies. We can rank these companies by export value. Below are some of the highest exporting companies in the region when shipping and logistics companies are accounted for and removed. If you would like a specific company’s shipping trend, product list, and export destinations, feel free to let us know.

Few of the Top Exporting Companies in the Atlanta Region and Export Value

Company Name

Estimated Export Value

C H Robinson International Inc

$320,742,526.62

Intervision Llc

$252,789,349.25

C-E Minerals Inc

$224,082,157.17

Ajc International Inc

$203,787,627.57

Graphic Packaging International Inc

$194,253,808.30

Agco Corporation

$177,131,957.98

Wal-Mart Stores Inc

$163,488,311.81

Ups Supply Chain Solutions Inc

$138,669,093.42

Pep Boys-Manny Moe & Jack Of Delaware Inc

$134,017,941.79

Toys “R” Us Inc

$125,239,215.25

Carotrans International Inc

$117,552,470.51

Kintetsu World Express (Usa) Inc

$109,905,121.16

Home Depot Usa Inc

$103,709,999.67

Costco Wholesale Corporation

$83,291,020.14

American Honda Motor Co Inc

$80,838,294.40

Botticelli Foods Olive Oil: Sourced from Italy or Tunisia? Pricing Differences?

This report uncovers sources of Botticelli Foods olive oil, HS:1509. Two countries supply Botticelli: Italy and Tunisia. Using Botticelli’s BOL trade data, which we provide, we find exactly why the 21 Tunisian imported shipments were worth more than the 65 shipments from Italy. More of Botticelli Foods olive oil is actually Tunisian.

Company Overview

Botticelli Foods is a company known for its excellent olive oil. Botticelli Foods is available at many American grocery stores. They offer high quality olive oil at a wholesale price in their big tins. Botticelli Foods is located in Hauppauge, New York. They can be contacted by phone: 631-543-7000 and e-mail: Info@botticelli-foods.com. Click here to view their website.

Botticelli Imports: Basics 

In 2010 Botticelli Foods brought in 86 imported shipments worth an estimated 7,498,263 dollars from October 2010 to October 2011. All these shipments came from two countries: Italy and Tunisia. Italy and Tunisia are two of the three largest suppliers of foreign olive oil to the United States. 76% of the shipments to Botticelli Foods were from Italy, while 24% were from Tunisia.

Botticelli imported an estimated 3.3 million dollars worth of commodities from Italy. While Tunisia’s shipments were much less, the estimated value imported from Tunisia was 4.2 million dollars.

Imports of Botticelli Foods from Italy and Tunisia by estimated value, number of shipments, and country of origin

Why are 21 Tunisian shipments worth more than 65 Italian shipments?

Number of shipments imported by Botticelli Foods from Italy and Tunisia, separated by category of commodities

An important question that can be asked is why are the 21 shipments from Tunisia worth more than the 65 shipments from Italy? With the full dataset of Bills of Lading from Italy and Tunisia we can find the answer to this question. The following graph documents a number of shipments from each country. The different colors represent the different commodities from each country. We see that Italy ships a diversified product catalog, including virgin olive oil and pasta, while Tunisia supplies olive oil. We also see that a number of the Italian shipments are empty, represented by the blue space on the top of Italy’s bar.

Estimated Value of extra virgin olive oil, olive oil, and pasta: couscous imported by Botticelli Foods from Italy and Tunisia

Botticelli Foods Imports by Value and Quantity: More Olive Oil from Tunisia than Italy?

Shipments do not necessarily mean the whole boat was full. Common sense would tell us that a boat full of olive oil would cost a lot more than a boat of pasta.

We used Botticelli Foods BOLs raw excel data, available here to find our answers. The first graph below represents the estimated value imported from each country separated by product code. The second graph represents quantity of the products shipped. We see that while there were only a few shipments of pasta, by quantity, it was the largest import from Italy. Even with the huge quantity it was worth less than the olive oil imported from Italy. We also see the large quantity of olive oil from Tunisia directly correlates with estimated value. The reason Tunisian imports were worth more than Italian imports is that a larger quantity of olive oil, which was worth more, was imported from Tunisia than Italy.

Quantity of extra virgin olive oil, olive oil, and pasta: couscous imported by Botticelli Foods from Italy and Tunisia

Contrary to common belief, Botticelli Foods gets more olive oil from Tunisia than Italy. The graphs provided were made from the BOL data. A complete, detailed MS Excel Spreadsheet is available for download by clicking the hyperlink. With data proving our points we can make surer statements and decisions, thus uncovering the reality of trade relationships.

United States Olive Oil Imports from Tunisia: Trade Trends and Company List

This report deals specifically with olive oil, HS: 1509. We list countries that the United States imports olive oil from with a focus on Tunisia. We display a chart of historical Tunisian olive oil exports. We conclude with a comprehensive list of the United States companies importing olive oil from Tunisia.

United States Olive Oil Imports by Country

The United States is the world’s second largest importer of olive oil, HS: 1509. Click here for olive oil world trade profile. The United States gets 92% of its foreign olive oil from four countries: Italy, Spain, Tunisia, and Morocco. Below is ranked list of the countries from which the United States gets olive oil. Countries are listed by value of olive oil shipped to the United States.

United States imports of olive oil 2010, countries rank listed by value and market share with pie chart

Tunisian Olive Oil Export Trend

Tunisia is the third largest source for imported United States olive oil. While the U.S. gets substantially less oil from Tunisia than from Italy or Spain, Tunisia is still an important source. It is the third largest source, yet it is home to only 10 million people. By comparison New York City alone has roughly 8 million people who live in the actual city and 19 million people who live in the metro-statistical area. Tunisia is also noteworthy because it has experienced recent political issues. Despite this fact Tunisia is a reliable source for olive oil. Below is a graph of Tunisian exports of olive oil over a five-year time frame.

Tunisian exports of olive oil to the United States trend over five years.

United States Companies Importing Tunisian Olive Oil

Available here is a list of individual companies in the United States importing Tunisian olive oil. Dot Foods is a food redistribution company that sets up manufacturers with distributors. Botticelli is a very popular olive oil that can be found in many grocery stores. Their large tin bottles provide exceptional quality extra virgin olive oil at a wholesale price. Below is a comprehensive list of seventeen United States companies importing olive oil from Tunisia. Company names, location, and presidents are included. One can google the various companies to learn more about any specific one.  Contact us for an MS Excel Spreadsheet of the complete company detail on these companies.

United State’s Companies Importing Olive Oil from Tunisia
Company City State President
Dot Foods Inc Mount Sterling IL Patrick F Tracy
Zb Importing Inc Circio IL Ibrahim Ziyad
Botticelli Foods Llc Hauppauge NY Salvatore Asaro
Vigo Importing Company Tampa FL Anthony Alessi Sr
Veronica Foods Company Oakland CA Michael Bradley
Tuts International Export & Import Co Inc Dearborn MI Ghais Shenouda
Interoil Services Houston TX
Amd Special Oil Llc Ramsey NJ Don Greco
Orlando Greco & Sons Import Llc Carol Stream IL Orlando Greco
Baroody Imports Inc Clifton NJ Baroody
King Zarda Ltd Steger IL Bhim Hans
Valdoliva International Inc Franklin OH Nicola Ranieri
Nundini Enterprises Inc Houston TX Giampaolo Nundini
Oles Envelope Corporation Baltimore MD John R Young
A & B Food Import  Corp Dallas TX Alia Meftahi
Borges National Usa Corporation Montvale NJ William Rahal
Iffco Inc Atlanta GA Parvez Bhiwandiwalla

United States Olive Oil Imports from Spain and Downloadable List of U.S Importers

This report deals specifically with olive oil, harmonized code: 1509. It covers Untied States sources of olive oil and imports of Spanish olive oil from the last five years. We conclude with a comprehensive list of U.S. companies importing Spanish olive oil.

United States Imports Olive Oil

The United States is the second largest olive oil importer in the world. They spent 1.6 billion dollars on foreign olive oil in 2009. For a profile of the world’s largest importers and exporters of olive oil, click here. They import 88% of their olive oil from three countries: Italy, Spain, and Tunisia. For a comprehensive list of companies importing olive oil from Tunisia and trend click here. Below is a 2010 ranked list of the top countries from which the United States buys olive oil. The pie chart represents market percentages of imported oil from each specific country. Spain is represented by the yellow slice accounting for 23.6% of Untied States imported olive oil.

2010 ranked list and pie chart of the top counties that the United States imports olive oil from, ranked by value and market share percent

Spanish Exporters of Olive Oil to the United States: Five Year Trend

Spain provides a pretty steady source of olive oil to the States. In 2006 the U.S. imported 175 million dollars worth from Spain. In 2008 they imported 192 dollars worth of Spanish olive oil. In 2010 they imported 205 million dollars worth. Below is a histogram / bar chart-graph representing the last five years of Spanish exports of olive oil to the United States by dollar amount per year. Spain is represented by the turquoise bar in the graph. While the amount fluctuates, Spain has maintained the strong position of second largest olive oil source to the United States for the last five years with only Tunisia even coming moderately close.

Spanish Exports of Olive Oil to the United States – Trends of the Five Years of Olive Oil Histogram : Bar Chart with Dollar Amounts from 2006 to 2010

United States Companies Importing Spanish Olive Oil.

Part of the reason Spain has maintained its strong position of second largest source of olive oil to the States is the American companies importing it. With PIERS we can view a comprehensive list of American companies importing Spanish olive oil. While Tunisia is unique in that it only has a handful of companies importing its olive oil, Spain has over one hundred and fifty U.S. companies importing it. Included below is a sample list of fifty of the one hundred and seventy United States companies importing Spanish olive oil. For a full excel list of these companies, with location, employment, president, etc. click this link.

 List of 50 out of the 170 United States Companies Importing Spanish Olive Oil
The Hain Celestial Group Inc Rex Discount Inc
Sysco Corporation Frontier Natural Products Co-Op
Big Lots Inc Hallstar Company
Hess Corporation Santini Foods Inc
Cost Plus Inc Jackson Family Wines Inc
Supermercados Econo Inc Badia Spices Inc
Haddon House Food Products Inc The Pasta Shop
American Rice Inc Paris Gourmet Of New York Inc
Goya Foods Inc Goya Foods Of California Inc
Southern Wine & Spirits Of America Inc Mhw Ltd
Ocean State Jobbers Inc Dekalb Farmers Market Inc
Bi-Rite Restaurant Supply Co Inc Zb Importing Inc
United Natural Foods Inc Supreme Oil Company Incorporated
Mercado Latino Inc Alanric Foods Distributors Inc
Connecticut Distributors Incorporated Napoli Foods Inc
Fedway Associates Inc Michael Skurnik Wines Inc
Olive Musco Products Inc Bel Canto Foods Llc
Alliance Bev Distrg Co Llc Dairyland Usa Corporation
American Rice Inc Julius Silvert Inc
Sovena Usa Inc A & M Special Purchasing Inc
Gonzalez And Tapanes Foods Inc Ljp & Sons Distributors Inc
Goya Foods Inc Italfoods Inc
World Finer Foods Inc International Delicacies
Kradjian Importing Coinc Unique Wine Company Inc
Kobrand Corporation Goya Foods Inc

Olive Oil – Harmonized Code 1509: World’s Top Exporters & Importers. U.S. Trade Profile

This report deals specifically with olive oil, harmonized code: 1509. We cover the world’s top exporting countries, world’s top importing countries and the United States’ import market of foreign olive oil by country.

World’s Top Olive Oil Exporters

In 2009 Spain was the world’s top exporter of olive oil. They exported 4.2 billion dollars worth of olive oil via ship. They exported 46% of the world’s total exported olive oil. Italy was the world’s second largest olive oil exporter, shipping out 3.1 billion dollars worth in 2009. Italy’s exporters made up 34% of olive oil exported globally. Spain and Italy together account for 80% of the world’s exported olive oil. The only other countries that command more than 5% of the market are Tunisia and Greece. Below is a pie chart representing the top ten countries exporting olive oil, ranked by value exported and market share. Red represents Spain and yellow represents Italy.

Pie chart of the top ten countries exporting olive oil, ranked by value of exported oil and market share percent

World’s Top Olive Oil Importers

Italy is the world’s top importer of olive oil, spending 2.6 billion on foreign olive oil. United States is the world’s second largest buyer of foreign olive oil. The United States spent 1.6 billion dollars on foreign shipped oil in 2009. This accounted for almost 17% of the world’s bought oil. The third largest buyer of foreign olive oil was France, spending 740 million in 2009, representing 28% of the world’s market via ship. The top five importing countries account for 63% of the imported olive oil, which means that the distribution of olive oil is more spread out among a number of countries than the production. Below is a ranked order list and pie chart of the top ten countries importing olive oil, ranked by value and market share.

Ranked order list and pie chart of the top ten countries importing olive oil, ranked by value and market share

United States Top Sources of Foreign Olive Oil

United States is the world’s second largest olive oil importer. 88% of America’s imported olive oil comes from three countries: Italy, Spain, and Tunisia. This follows the world’s general trend of largest olive oil suppliers. America spent 482 million dollars on Italian olive oil in 2010. They spent 205 million on Spanish olive oil and 81 million on Tunisian olive oil. Below is a 2010 ranked list and pie chart of the top countries that the United States imports olive oil from, ranked by value and market share percent.

2010 ranked list and pie chart of the top countries that the United States imports olive oil from, ranked by value and market share percent

Diamond Foods Inc. Export Profile Analysis of Imports of Walnuts by Spain

Diamond Foods Inc  

Diamond Foods Incorporated is a company that most Americans are familiar with. Kettle Chips, Emerald snack nuts, Pop Secret popcorn and Diamond of California snack and culinary nuts are all brands under Diamond Foods. Founded in 1921, Diamond Foods has more than 1,700 year round employees. Here is link to the company website.

Here is an excerpt, “San Francisco-based Diamond Foods is a high-growth innovative packaged food company focused on building, acquiring and energizing brands including, Kettle Chips, Emerald snack nuts, Pop Secret popcorn, and Diamond of California snack and culinary nuts. The Company’s strategy is to build brands from the ground up as well as identify opportunities to energize and add value by making a relevant connection to the contemporary consumer. Diamond’s products are distributed globally in stores where snacks and culinary nuts are sold.Founded in 1912 with a strong heritage under the Diamond of California brand, Diamond Foods completed its initial public offering in July, 2005. The Company has approximately 1,700 year-round employees and its stock trades on the NASDAQ Global Select Market under the symbol DMND.”

They are leaders in American snacks and nuts. America is the world leader in nut exporters, click here for a world view on nut trade.

Diamond Foods Inc Export Shipments

In the last 12 months Diamond Foods Inc has exported 967 shipments worth an estimated 45 million dollars. Thailand was the destination of almost half of these shipments, with an estimated value of 6.8 million dollars. Spain received 10% of Diamond’s exports in 104 shipments, worth an estimated 12.5 million dollars. Spain is the second largest country buying United States nuts. By worth Spain was Diamond Food’s largest buyer. Below are the top destinations by shipments and value of Diamond Food’s exports.

List of top countries receiving Diamond Food exports, by shipments and overall value. Mainly nut and snack exports to Thailand, Spain, Germany, and Netherlands

Diamond Foods Exports to Spain revenue by product category, Walnuts

Export Product Breakdown

Products HS: 080231 and HS: 080231 are both walnuts. They accounted for 33% of all shipments. While they only account for a third of Diamond Food’s exports by shipment, walnuts were worth 34.5 million dollars of Diamond Food exports. Walnuts constituted roughly 77% of Diamond Food’s waterborne foreign export revenue. This is why so much revenue was brought in from Spain. 76% of the last 12 months of shipments to Spain were walnuts. Walnuts accounted for 91% of Diamond Food’s generated export revenue from Spain. This custom pie chart was generated from analysis of Diamond Food’s export shipment data, constituted of 12 months of bills of lading. To preview raw data click here.

Nut Export Report: U.S. Companies Exporting Almonds to the United Arab Emirates

United States Nut Exports

The United States is the number one world exporter of nuts, HS: 0802, which include pistachios, walnuts, cashews, peanuts, almonds, etc. Waterborne exports alone accounted for 6.7 billion dollars in sales of American nuts to foreign countries in 2009. As a world player, America occupied 44% of the world market for nut sales. The world’s second largest exporter of nuts was Turkey, occupying 11% of the market. Untied States nut exports as a percentage of the world’s total is represented by the red slice in the pie graph below.

List of world’s top nuts – pistachios, walnuts, cashews, peanuts, and almonds exporters. Ranked by value and world trade market share. 

United States Destinations of Exported Nuts 

United States nuts tend to go to Asia, Europe, and the Middle East. In  2010 Asia bought 36% of U.S. nuts, Europe bought 35%, and the Middle East accounted for 15%. The top individual buyer was Hong Kong who bought almost 16% of U.S. nuts. Spain and Germany each bought around 8% of U.S. nuts each spending more than 300 million dollars. The small country of United Arab Emirates spent 233 million dollars on U.S. nuts in 2010. The United Arab Emirates is home to about 8 million people, thus they spent the largest amount per person on nuts.

United States Exports by country of nuts listed by value and market percentage.

United States Exports of Nuts to the United Arab Emirates

The United Arab Emirates prefers one type of nuts: almonds. Over 85% of all U.S. nut exports to the United Arab Emirates were almonds, shelled, HS: 080212 and unshelled, HS: 080211. Below is a product breakdown report for United States exports to the United Arab Emirates regarding nuts. It breaks down the umbrella code of nuts, HS: 0802, into more specific six-digit subcategories, HS: 080212, almonds. Also included is a pie chart representing the four digit product code divided by specifics. The orange and gold slice together represent almonds, shelled and unshelled.

Product breakdown of United States Nut exports to United Arab Emirates, Middle East, almond buyers. Product categories are six digit Harmonized code of Nuts HS- 0802

United States Companies Selling Nuts to the United Arab Emirates

Below is a comprehensive list of 56 U.S. based companies exporting nuts to the United Arab Emirates.

United States Companies Selling Nuts to the United Arab Emeritus 
Cheney Bros Inc Cummins Filtration Inc Derco Holdings Llc Paramount Farms Inc
Hershey Company Primex International Trading Corp Sunview Marketing International Galco International
Boc Group Inc The ( A Delaware Corp) Alpine Pacific Nut Co Pom Wonderful Llc Western Nut Co
Adm Rice Inc Fair Trade Corner Inc Beards Quality Nut Company Llc Jim Crecelius
Ike Trading Co Ltd Frazier Nut Farms Inc Scheidegger Trading Co Inc Treehouse California Almonds Llc
Settons International Foods Inc Grower Direct Nut Company Inc Jessup Norris And Trunick Inc Venture Lighting Latin American
Specialty Commodities Inc Hilltop Ranch Inc Borges Of California Inc Zanontian & Sons Import Export Corporation
Farmers International Inc Nutrinut Inc Meridian Nut Growers Llc Kush International Inc
The Chilcote Company Fisher Nut Company Minturn Nut Co Inc A P Esteve Sales Inc
Shoei Foods (Usa) Inc North Valley Nut Inc Natural Fashions Inc The Food Source Inc
Kimberly Clark Corporation Terra Nova Trading Oneonta Trading Corporation Crown Products Inc
Lion Raisins Inc Foodsource Inc American Trading International Inc The Fresh Connection
Jess Smith & Sons Cotton Llc Crystal International Kraft Foods Global Inc Conagra Foods Inc

Untied States Imports of Nuts from Mexico: Specific American Companies

United States Top Sources of Foreign Nuts 

The United States is the ninth largest importer of nuts in the world. Nuts, HS: 0802, include walnuts, pecans, pistachios, macadamia, peanuts, almonds, etc. For a world view of nut import and exports click here.

The United States received 46% of its foreign nuts from Mexico. In 2010 this value was near 200 million dollars. The second largest source for imported nuts was China. In 2010 the U.S. imported 88 million dollars of Chinese nuts, accounting for 21% of all its imported nuts. Below is a list of the top ten countries from which America imported nuts, rank ordered by value. Also included is a pie chart displaying market percentages dominated by a each country. Mexico, the largest source, is represented by the red slice.

Top ten sources for American imported nuts, HS- 0802, almonds, peanuts, macadamia, etc. Rank list of countries accompanied by pie chart of nut import market.

United States Historic Nut Import from Mexico 

The number one supplier for U.S. imported nuts is Mexico. Almost 200 million dollars was spent on Mexican nuts in 2010. According to more historic data, this large amount is a recent trend. Below is a histogram displaying historic import nut data from Mexico. Until 2004 the United States had never spent more than 100 million dollars on Mexican nuts. Since 2004 the amount of Mexican imported nuts has steadily been increasing. Is this because of the decline of the U.S. dollar value or because it imports a higher amount of nuts? A look at the dollar to peso reveals that one dollar was worth about 10 pesos in 2000 while in 2010 it was worth around 13 pesos. It is likely that this increase of value is associated with an increase of product. This is supported by the increase of Nut export by Mexico.

Histogram: bar chart of United States nut imports from Mexico by value and years, all-inclusive 1989 to 2010

United States Companies Buying/ Importing Mexican Nuts

With PIERS StatsPlus we have special access to individual U.S. companies importing Mexican Nuts. The full excel spread sheet is available by request. Below is a list of all 11 U.S. companies importing Mexican Nuts. United Natural Foods is one of the largest companies. Their web site is www.unfi.com and their corporate headquarters are located at 313 Iron Horse Way, Providence, Rhode Island. This same type of information is available for Dekalb Farmers Market, Kalustyan, Mid Valley Nut Company, and the rest of the American importing companies of Mexican nuts.

All eleven individual Untied States companies importing Mexican Nuts, complete spreadsheet data available in link above. Companies names, location, presidents, and websites

Nuts HS: 0802, World’s Top Importers, Exporters, and Who is Buying American Nuts


This report covers the world’s top importers and exporters of edible nuts HS: 0802. Harmonized code 0802 covers most nuts, almonds, pistachios, walnuts, hazelnuts, etc. This report recognizes the largest importing countries of United States nuts and displays this export market over a five-year time frame. This is done through PIERS StatsPlus program analyzing waterborne trends.

Rank order list with a pie chart representing the world’s top ten countries importing foreign nuts, ranked in descending import value.

World’s Leading Importers of Nuts HS: 0802

Germany was the world’s largest importer of foreign nuts. In 2009 they imported 1.6 billion dollars worth. Hong Kong and Italy followed closely behind, both spending roughly 1.3 billion dollars worth in 2009. The United States was the world’s ninth largest importer of nuts.  Below is a rank order list with a pie chart representing the world’s top ten countries importing foreign nuts. The world’s top buyers of foreign nuts are ranked by descending import value.

World’s Leading Exporters of Nuts HS: 0802

The United States is the world’s leading exporter of nuts HS: 0802. In 2009 the US exported 6.7 billion dollars via sea, making up 44% of the world’s exported nuts. Turkey was the second largest exporter, selling 1.7 billion dollars worth in 2009. Iran was the third largest exporter at 1 billion dollars worth sold. Below is a pie chart and rank order list by country and value of exported nuts. The red section on the graph represents the Untied State’s remarkably large market share dominance of world nut exports.

World’s Top Exporters of nuts, HS 0802, rank order list of country in descending order with pie chart and monetary value of exports. Pie chart represents market share

Top Countries Buying American Nuts

Hong Kong is now the largest buyer of American nuts with 653 million dollars spent in 2010. Hong Kong has only recently become the largest buyer of American nuts. In 2008 Hong Kong imported 293 million dollars worth of American nuts. In 2009, they doubled their American nut imports. The small country of the United Arab Emirates was the fifth largest buyer of American nuts in 2010 and has shown substantial market growth in the past few years. They imported 90 million dollars worth in 2008 and doubled that amount to 233 million in 2010.

Below is a chronological histogram of the top countries importing American nuts over the course of five years.

American export trend histogram: bar chart graph for the top countries buying United States nuts. Includes five years of data for nut exports by country and value

United States Medicine Imports from Ireland: U.S. Importers and Irish Suppliers

Medicine in Doses: United State’s Import Position and Countries of Source 

This report deals specifically with Medicine in Doses, HS: 3004. United States is the world’s second largest world importer of medicine in doses (click here for our world import-export profile of medicine in doses). Of all the countries that supply United States, Ireland is the number one. U.S. imported around 9 billion dollars worth of medicine in doses from Ireland in 2010 alone, accounting for almost 18% of its total imported medicine.

United States Imports of Medicine in Doses by country of origin. Top sources are Ireland, Germany, and Israel. Pie chart : graph of top ten United States import source countries.

Irish Exports of Medicine in Doses

In 2009 Belgium bought 46% of all Ireland’s exported medicine, costing them around 19.5 billion dollars. The United States bought around 9 billion dollars worth, accounting for 22% of Ireland’s exported medicine in doses. Belgium and the Untied States are the world’s largest buyers of foreign medicine. Alone, they account for 68% of Irish foreign sales of medicine. Below is a pie chart showing exports of medicine by Ireland in 2009. Untied States is represented by the yellow slice. Data source is United Nations Comtrade.

Global Irish exports of Medicine in Doses country list, value, market share, and pie chart : graph, notably United States and Belgium

United States Companies Buying Irish Medicine

The United States has approximately 33 companies buying Irish medicine. Some of the well-known ones include: Abbot Laboratories, Arch Chemicals, Evonik Degussa, Meadwestvaco Corp, Merck & Co Inc, and Teva Pharmaceuticals. Below is a brief list of ten companies with their location and website. For full list please click on excel file here.

United States Companies Importing Irish Medicine in Doses

Company State Web Site
Merck & Co Inc NJ www.schering-plough.com
Abbott Laboratories IL www.abbott.com
Meadwestvaco Corporation VA www.meadwestvaco.com
Ivax Corporation FL www.ivax.com
Evonik Degussa Corporation NJ www.degussa.com
Glazers Wholesale Drug Company Inc TX www.glazer.com
Arch Chemicals Inc CT www.archchemicals.com
Allergan Usa Inc CA www.allergan.com
Organon Pharmaceuticals Usa Inc NJ www.organon-usa.com
Teva Pharmaceuticals Usa Inc PA www.lemmon.com

Irish Companies Selling Medicine / Pharmaceuticals  to the Untied States

We would not be complete without divulging the Irish companies. We have a full list of all 34 Irish companies that sell the United States medicine in doses. Click here to view full data set of companies. Below is a snapshot of ten companies with name, street address, town, and country.

Irish Companies Selling Medicine in Doses to the United States

Medicine in Doses: World Trade Import-Export Overview and United State’s Trade 

Medicine’s Harmonized Code for World Trade

Medicine in measured doses registers as HS: 3004. These are mixed or unmixed products separated by doses. Anti-infective drugs, cardiovascular medicines, anticonvulsants, sedatives, tranquilizers, laxatives, antihistamines, etc. all fall under this category, HS: 3004. These medicines are usually used for retail. The US census schedule B search engine can be used to produce a full list. Type “3004” into the search bar at https://uscensus.prod.3ceonline.com/.

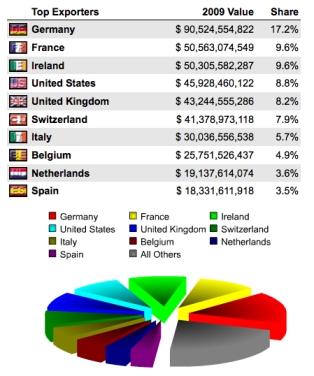
World’s top medicine exporters by country, value and percent. Top players include Germany, Ireland, Switzerland, France, and United States. Pharmaceutical world export graph pie chart.

World’s Top Medicine Exporters

Through PIERS Prospects and Stats Plus, we gain access of medicine exports shipped. Medicine is a unique product category because Western countries still occupy the largest exporting positions. We find that Germany is the largest exporter of medicine, selling 90.5 billion dollars worth in 2009. France was second, shipping out 50.6 billion dollars worth, followed closely by Ireland. United States was the fourth largest medicine exporter in the world, selling roughly 46 billion dollars worth abroad. They occupied 8.8% of the market in 2009.

United States Exports of Medicine

United States is the world’s fourth largest medicine exporter. With PIERS we can view countries who buy medicine from the United States. The number one buyer of United States made medicine was Canada, who spent 2.9 billion dollars in 2010. The Netherlands were the second largest buyer, spending 2.7 billion dollars on U.S. medicine. United Kingdom was the third largest, followed by Japan and then Spain. These 5 countries combined spent almost 12 billion dollars on United States shipped medicine in 2010.

Untied States exports of medicine by receiving country- list by top countries, value, and market share

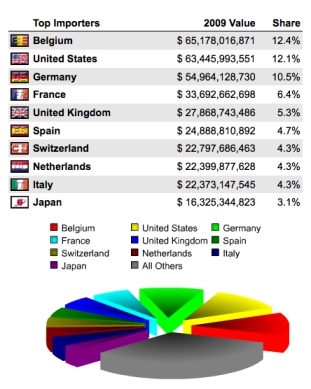
World’s top medicine importers by country, 2009 value and market share. Top countries are Belgium, United States, Germany, and France. Pie chart : graph of top countries.

World’s Top Medicine Importers

Surprisingly Belgium is the world’s top medicine importer, spending 65 billion dollars in 2009 on foreign-made medicine. The United States was the second largest importer, spending 63.5 billion dollars on foreign-made medicine. Germany imported about 55 billion dollars worth of medicine in doses in 2009.

United State’s Top Sources for Imported Medicine

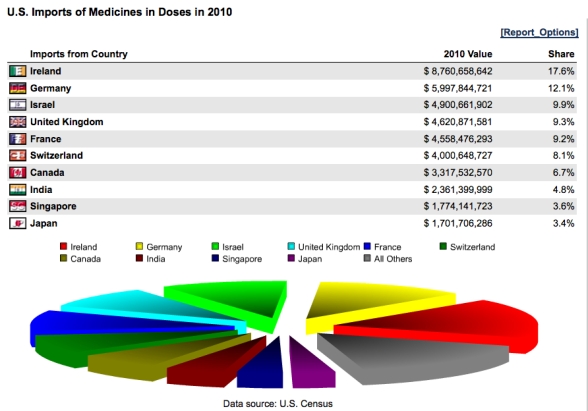
The United State’s main source for foreign-made medicine in 2010 was Ireland. They imported 8.8 billion dollars from this one small country. Germany was the second largest source, selling the U.S. approximately 6 billion dollars worth of medicine in 2010. Israel was the third largest source. In 2010 the U.S. bought 4.9 billion dollars worth of medicine from Israel. The United Kingdom was the fourth largest source and France was the fifth. The medicine imports from these five countries combined accounted for 58% of U.S. total imported medicine in 2010.

Pie chart of top Untied States medicine import sources by country and value.

U.S. Medicine Imports from Israel Including Importers and Suppliers

Medicine in Doses: United State’s Import Position and Countries of Source

This report deals specifically with Medicine in Doses, HS: 3004. United States is the world’s second largest world importer of medicine in doses (click here for our world import-export profile of medicine in doses). Israel is America’s third largest source of medicine in doses. United States imported 4.9 billion dollars of medicine/ pharmaceuticals from Israel in 2010. In this year Israel accounted for 12% of all U.S. spending on foreign-made medicine. For a brief on medicine world trade, imports and exports, click here.

Below is a pie chart displaying United States imports of medicine by country of origin.

United States Imports of Medicine in Doses by country of origin. Top sources are Ireland, Germany, and Israel. Pie chart : graph of top ten United States import source countries.

Israeli Companies Exporting Medicine to the Untied States

Israeli Companies Selling the United States Medicine

With PIERS Prospects we can gain a view of the individual Israeli companies selling medicine to the United States. There are a total of 17 Israeli companies selling pharmaceuticals to the United States. Below is a list of all 17 Israeli companies. For further insight, the entire dataset with company name, location, phone number, product codes, etc, can be downloaded here.

United State’s Companies Importing Medicine from Israel

United States Companies Buying (Importing) Israeli Medicine

What United States companies are importing Israeli medicine? There are 22 United States companies importing pharmaceuticals / medicines from Israel. With the data set we can arrange companies by plant size, sales, or year established. I arranged the companies by corporate employees. Below is the full list of all 22 United States companies importing medicine from Israel. If you would like to look further into the data, the full excel spread sheet is available for use here. For a more in-depth trade snapshot of a large American pharmaceutical company, check out our profile on Eli Lilly, whose main foreign source of imports was Israel (Link to Eli Lilly).

Eli Lilly Pharmaceuticals: Trade Overview and Import/ Sourcing Data from Israel

Eli Lilly Pharmaceuticals 

Eli Lilly is the tenth largest pharmaceutical company in the world. Built in 1876, Eli Lilly is headquartered in Indianapolis, Indiana. Over 38,000 employees work for Eli Lilly. While it is an American company more people are employed outside the United States (20,657) than within the country (17,400). Eli Lilly products are sold in 125 countries. Eli Lilly brings a large benefit to Indiana where it has 11,500 employees who receive an average salary and benefits of 150,000 dollars. Some of the most known Eli Lilly brands are Cialis, the viagra substitute, Cymbalta, an anti-depressant, Gemzar, a cancer inhibitor, Methadone, the replacement painkiller for treating heroin addicts, Prozac, the famous serotonin blocker, and many others (click here to see full list). With PIERS Prospects we can track waterborne imports and exports.

Exports of Eli Lilly Interamerica Pharmaceuticals

88% of the last 12 months of shipments sent and received by Eli Lilly were exports, totalling an estimated value of 250 million dollars. Of the many exports 42% of the goods shipped out went to the United Kingdom with an estimated value of 118 million dollars, 29% went to Brazil with an estimated 42 million dollars, and 5% went to Panama with an estimated value of 18.6 million dollars.  Download Detail of Lilly Exports here.

Top Export Destinations for Eli Lilly Interamerica Pharmaceuticals, Including location, shipments, and estimated values. Dollar values of pharmaceutical exports from Eli Lilly to United Kingdom, Brazil, Panama, and Australia

Imports of Eli Lilly Interamerica Pharmaceuticals

Eli Lilly has a unique import profile. Israel is Eli Lilly’s largest import source. Israel supplied 128 shipments to Eli Lilly in one year, amounting to an estimated value of 137 million dollars. The United Kingdom was the second largest source for Eli Lilly. The UK supplied Eli Lilly with 47 shipments at an estimated value of 44 million dollars.

Imports of Eli Lilly Interamerica Pharmaceuticals, list by country of origin, source, shipments, and estimated value, including countries Israel, United Kingdom and Puerto Rico

Eli Lilly Imports from Israel: Vitamins and Anti-Infective Drugs, 

Eli Lilly spent 137 million dollars in one year on importing Israeli goods. Vitamins, HS: 300450, are the largest import by volume. Anti-infective drugs, HS: 300490, have the highest import value. Both of these products are sold to Eli Lilly by one company: Koffolk Animal Health & Nutrition. Koffolk develops animal health and nutrition products (click here for their website). Eli Lilly shipment data from December 2010 to December 2011 bought from Israel is available here.

Microwave Ovens: Trade Profile, U.S. Importing Companies, and Free Data Download

Microwave Ovens HS: 851650

Microwave Ovens HS: 851650, were invented around 1947 after WWII. Microwave ovens heat food using microwave radiation to excite molecules inside the food. They essentially shake the water molecules to such speed that they become heated. Because of the ease, speed, and simplicity of heating food, as of 2012 microwaves are a part of most kitchens in the United States.  Microwave ovens generally have a long life span, so much world production occurs in developing countries. A country must have a stable electrical source for the microwave oven to be of any use. What does the global market of Microwaves look like?

The World’s Top Exporters and Importers of Microwave Ovens

The world’s top exporter of Microwave ovens is China. They dominated 58% of the market and produced 1.8 billion dollars from microwave oven sales to foreign countries. Thailand was the second largest seller, holding 13% of the sales market, producing 395 million dollars. See image below for pie chart and list of top countries. The United States is not in the standing for microwave sales, but is the world’s leader in buying/ importing foreign-made microwave ovens. In 2009 alone the United States of America imported 28% of the world’s internationally sold microwaves, spending 873 million dollars on these foreign-made goods. The second largest importer was Japan, who spent 292 million dollars in 2009, roughly a third of what America spent. Where does America get all its microwave ovens?

Global microwave oven importers and exporters by country: China, Thailand, Malaysia, UK, United States, Japan, Germany, France pie chart graph monetary amount value 2009 world’s top

America’s Top Sources of Microwave ovens. 

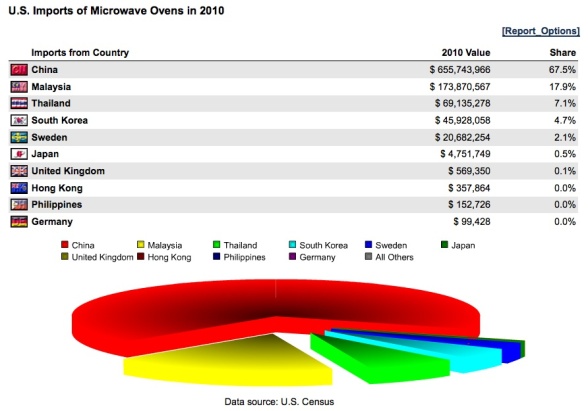
In 2010 alone United States spent 656 million dollars on Chinese made microwave ovens. 68% of all of its foreign-made microwaves came from China and 98% of its microwave ovens came from Asia. The second largest source was Malaysia. The U.S. spent 174 million dollars on Malaysian microwaves in 2010. Below is a pie chart representing the countries that export microwave ovens to the United States. A simple question that comes to mind is what companies are buying all these Chinese made microwaves?

Global microwave oven importers and exporters by country: China, Thailand, Malaysia, UK. United States, Japan, Germany, France pie chart graph monetary amount value 2009 world’s top

United States Companies Buying Chinese made Microwave Ovens

The third on the list is Conair which is a company that we have previously looked at: click here for Conair Trade Profile. The complete 88 company dataset lists the top three chiefs for each company, commodity information, sales amount, employment, ownership, web addresses, street address, etc. Below is a clip from the spreadsheet data file with the top five companies ranked by total sales. Click here to download the entire dataset of 88 United States companies buying Chinese made microwave ovens.

Top United States source companies buying Chinese made Microwave Ovens listed by total sales ranked data set. Excel free corporate knowledge head executive company chiefs, commodity information, sales amount, employment, ownership, web addresses, street address

Electric Space Heaters: Trade Profile, U.S. Importing Companies, and Free Data Download

Electric Space Heaters, HS: 851629

Electric Space Heaters, Harmonized Coded: 851629, are plug-in heaters. These are commonly used by construction workers in the winter to keep from freezing within the depths of an unfinished house. They are also commonly used by Americans who wish to be economical. Space heaters reduce one’s reliance on central heating units which can be very expensive to maintain, repair, and use. Central heating units generally heat the entire house, thus they can be extremely wasteful, as many rooms within the house may be unused or unoccupied at a certain time. Space heaters can be set in one room, restricted to a certain time and temperature, saving the user electrical expenditure. Space heaters can also be used in locations where the central heating does not efficiently reach, like a basement, attic room, bathroom, etc. Space heaters are a common commodity in the United States, so we may ask: what does the global market look like, where does the United States fit into that schema, and what specific U.S. companies import foreign-made heaters into the States?

World Import and Export Market for Space Heaters

China is the world’s leading seller/exporter of electric space heaters. They dominate 70% of the world’s export market. China produces 70% of all foreign bought electric space heaters. China made an estimated 1.3 billion dollars in 2009 alone from its export sales of space heaters. Germany was the second largest exporter and the United States was sixth, producing 46 million dollars from space heater sales abroad. United States was also the world’s leading importer/ buyer of foreign-made electrical space heaters. They bought 23% of the world’s for-sale heaters. In 2009 Americans sent out 447 million dollars overseas to foreign lands for electric space heaters. Below is a list of the top exporters and top importers by value accompanied by a pie chart displaying country percentages of market dominance.

List of the top exporters and top importers by value accompanied by a pie chart displaying country percentages of market dominance electrical space heaters graph comtrade data percentage dollar amount 2009 world overview

United States Sources of Foreign Made Electrical Space Heaters

The United States is the world’s top importer of foreign-made electrical space heaters importing most of them from one location: China. In 2010 the United States imported 88% electrical space heaters from China.  The overall 2010 trade balance (export – import) in electric space heaters is a negative 508 million dollars. So what specific United States companies are buying and importing these Chinese products?  We have available for free download a complete dataset with all 332 U.S. companies that are importing Chinese made electrical space heaters. Below is a screen shot of the dataset with company names arranged by employment number. We see the U.S. Army and Wal-Mart at the top of the list. Download the free dataset here and run any kind of analysis you like. The dataset includes: company name, product information, employment, sales, corporate executives, web address, street address, etc. Enjoy.

Top United States companies importing Chinese made goods specifically electrical space heaters full data set available free download world trade shipping and imports corporations 

Conair: World Trading Profile and Sourcing Report

Conair Corporation

Conair Corporation was established in 1959. The company is a leading manufacturer of a broad range of personal and health care appliances. A few divisions under Conair are: the personal care division (leader in hair dryers and curling irons), Interplak (electric toothbrushes), Travel Smart (traveling accessories), and Allegro (handbags and beauty cases). Conair has even expanded to the kitchen appliance market with Cuisinart and Warning divisions. For a full list of all of Conair’s corporate product divisions click here.  A major distribution center of Conair lies in the Vally of Sun MSA, Phoenix, Arizona (click here for Phoenix Trade Profile).

Conair Corporation Imports 

Conair received 93% of all foreign-made imported products from one source, China. Conair imported 240 million dollars worth of Chinese goods in one year, crossing the Pacific Ocean in 3,294 shipments. Hong Kong, another part of the present day People’s Republic of China, is the second largest source for Conair imported goods. Costa Rica makes the list as well with 19 shipments adding up to an estimated value of 1.7 million dollars.

Top countries import sources for Conair Corporation shipments People’s Republic of China, Hong Kong, Costa Rica image jpg percents estimated value trade

Conair’s Top Commodities

Conair has an extremely diverse import product catalog. They have over 150 separate categories of imported products. By value the number one commodity imported by Conair was HS: 851671, electric coffee and tea makers. The second most valuable import commodity was HS:850940, electronic food grinders. Stainless steel kitchen articles, HS: 732393, were the third most valuable, worth 21 million dollars. Electric hair dryers were fourth, HS: 851631, worth 18 million dollars.

Conair’s top imported commodities by value and shipment one year trade harmonized code percentage item descriptions foreign made goods imported bought by the United States over annually

BOL Details

We have a full excel spread sheet of all 7400 shipments of imported products received by Conair from 10/30/2010 to 11/30/2011. In this excel file there are multiple categories. Once downloaded one can sort any way he or she pleases with common data sorting products like Microsoft Excel or OfficeOrg. For simplicity, I organized the data by value of shipment.  Listed below are the most heavily laden vessels by worth. Displayed are the shipping dates, shippers, addresses, estimated values, and product descriptions.  (Click here to Download).

Data of shipments made by Conair from India, China, Costa Rica individual bill of landings excel spread sheet download link here in text free BOL international trade data United States import sources

PetSmart: World Trading Profile and Sourcing Report

PetSmart Inc

PetSmart is a pet supplies and services retailing chain. Headquartered in Phoenix, Arizona (click here for Phoenix trade profile) PetSmart was founded in 1986. By 2010, it boasted roughly 1,160 PetSmart stores serving all pet needs from birds, fish, cats, dogs, gerbils, and horses.

PetSmart Inc Imports by Country

PetSmart Inc imports an annual estimated value of 200 million dollars worth of waterborne products. These come in a total of 2,141 shipments. 1,852 of these shipments come from China, click here for shipment excel data sheet, accounting for an estimated value of 173 million dollars worth. 9% are from Thailand and 3% are from India. The 3% of shipments from India make up an estimated value of 5.8 million dollars worth of imports.

Top counties of import sources by Petsmart Inc overseas foreign value mtons shipments dollar amount chart shipping trends location China, Thailand, India

Top Commodities

The top commodities imported by PetSmart are HS 420100, Saddlery, Harnesses, and Leads of any material. These are anything from horse saddles to dog muzzles and leashes. The import value of this one product code alone is 131 million dollars annually. The second most valuable import commodity is HS 950390, toys and parts. These are all the specialty devices, tennis balls, cat towers, chewy stuffed animals, etc. Toys constitute the second largest section of imports by value, accounting for 55 million dollars of imports.

Top Petsmart imports; value by product and shipment. harmonized standard code. Petsmart suppliers overseas.

2nd top Petsmart imports; value by product and shipment. harmonized standard code. Petsmart suppliers overseas.

PetSmart Import Companies 

Best Made Toys Global Limited is just one source company for PetSmart, click here to see their website. They are a Chinese based company that supplies about 6 million dollars of the HS 4201, saddlery, harnesses, and leads. Dan-Dee International Limited is another source, mainly of stuffed toys and parts. Below is snap shot of some PetSmart source companies.

Click here to download the full PDF of the companies.

Click here to download a complete, detailed record of over 300 of Petsmart’s shipping manifests.

BIC Corporation, World Trade Profile and Sourcing Report

Société Bic to BIC Corporation

1950 Paris, the ballpoint pen was undergoing a major change. Marcel Bich discovered an improved process for manufacturing ballpoint pens and started his own company. This high quality, yet inexpensive, BIC Crystal pen quickly gained popularity. Spreading in European markets, BIC pens started popping up in Belgium, Netherlands , Switzerland, Spain, and Ireland. By 1958 BIC spread to United States, with BIC Corporation locating their subsidiary headquarters in the Bridgeport MSA (Click here for Bridgeport MSA Trade portfolio). The United States now accounts for more than half of the company’s worldwide sales. The company’s products have diversified, leading BIC to be a world leader in lighters, pens, shaving razors, and other office stationary.

BIC Corporation Imports by Country

BIC imports a total of 714 shipments with an estimated worth of 48 million dollars from a diverse source of countries. 52% of their annual shipments are from China with an estimated worth of 26 million dollars. 11 million dollars worth of supplies come from Spain in 106 shipments. 5 million dollars worth of products come from Malaysia, 4 million from Japan, and 2 million dollars worth from Korea and France.

BIC Corporation imports from select country region in order of shipment received to the United States from China, Spain, Malaysia, Japan, Korea and France Chart list and estimated value

BIC Corporation Imports by Commodity

BIC Corporation has a large list of diversified products. The top commodity imported by shipments and value is BIC’s lighters. BIC is the worldwide leader in lighter sales across multiple continents. This single import accounts for 24 million dollars in one year alone, arriving in 180 shipments. The second largest commodity imported is ballpoint pens HS 9608 with an estimated value of 7 million dollars. Another notable import is BIC’s razors, with an estimated value of 700 thousand dollars. 4.7 million dollars worth of non-printing ink, HS 321590, arrive in the United States as well.

Top commodities lighters ballpoint pens razors BIC corporation list by imports by shipments and value percents chart estimated value dollars

BIC Corporation Imports from Malaysia: Ink and Source Company

With PIERS Prospects we can look at individual shipments BIC Corporation is bringing in by country of origin. Malaysia, a unique source of imports, exports mainly Ink to the United States through BIC Corporation. This ink is the non-printing type.  When we look at an individual bill of lading we find that this ink is BIC Wite Out. Malaysia exports almost exclusively correctional fluids, whiteouts, and whiteout tape. We can also view the source-company of these products,  Widetech Manufacturing.

Company source for Malaysia imports by BIC white out correction fluid Bill of Lading Widetech manufacturing exports United States imports commodity and destination. Commodity description of BIC imports from Malaysia whiteout quick dry correction fluid source

Cheese, HS Code 0406: World Market Overview

Cheese: World Market Overview

Cheese, HS: 0406 and S.I.C. 2022, is made from almost any animal’s milk. Produced from coagulation of the proteins and fats of milk, cheese is a natural way to preserve milk. Since cheese manufacturing goes so far back in human history, various methods have been reformed through generations of expertise, contributing to a vast array of specialty cheeses by region, country, and family.

The United States is the top cheese producer, making 4.3 million metric tons annually. Germany is the world’s second largest producer with 1.9 million metric tons followed by France at 1.9 and Italy at 1.5. If we group the European countries as the European Union then they are by far the largest cheese producer. The top cheese consumers per capita per year are Greece, France, Iceland, and then Germany. The United States is the 15th largest world cheese consumer per capita per year according to the International Dairy Federation. The accompanying chart portrays per capital consumption of cheese by various countries.

Top Cheese World Exporters by Country

The world’s top exporter of cheese is Germany, who made 7 billion dollars from sales of cheese to foreign countries in 2009. France was close behind in cheese exports, bringing in 6.7 billion dollars from cheese sales abroad. The Netherlands brought in 5.8 billion dollars and Italy brought in 4 billion dollars in 2009 alone from foreign sales of cheese. Top European countries: Germany, France, the Netherlands, Italy, Denmark, Ireland, Belgium, Switzerland, and Poland make up 9 of the top 10 world sellers of cheese and 72% of the world’s exported cheese value according to the United Nations Comtrade.

Top cheese export countries European pie chart and list percentage of world market and value 2009

United States Imports of Cheese by Foreign Country

Italy is the United State’s largest source of foreign cheese, composing 29% of the foreign cheese bought. United States spent 278 million dollars in 2010 alone on Italian cheese. The second largest source of foreign cheese is France composing 15% of the cheese bought and 142 million dollars.

United states import of cheese and curd in 2010 by country pie chart and list of countries by value of foreign cheese

Foreign Sources of Italian Cheese Coming to the States: Companies 

Italy, being the largest supplier of foreign cheese coming into the United States, deserves a closer look. With PIERS Prospects we can see the Italian sources listed by company. There are a total of 236 Italian companies importing cheese to the United States. With PIERS we have access to an excel document of these companies that includes company name, street address, sales, phone number, employment, year established, main products, company chief names, etc. Below is a screen shot of the top ten Italian cheese exporting companies listed by overall sales. Click here for full excel document including information for all 236 Italian cheese export companies.

Top ten Italian cheese exporters to United States with phone number, street address, corporate chief executives, sales employee number, butter, milk, cheese, dairy products, location imports excel trade data document list spreadsheet

Norseland Inc.- Trade Profile and Import Sources

Norseland Incorporated

Norway has been a significant source for American specialty cheeses for many years. Jarlsberg, just one brand under Norseland Inc, is the number one brand of specialty cheese in America. It has been exported to the states for over 40 years. This cheese is manufactured in 20 lb wheels and 10 lb loaves. Because of the longevity of cheese and its heavy weight, it is a product that requires shipping to cross the world. Some other notable Norseland Inc cheese products are Norwegian Specialty, Woolwich Dairy, Garcia Baquero, Old Amsterdam, Gabriella, Suprema, and Ilchester. Norseland Inc has over 500 sales representatives in the United States alone. In Bridgeport, Connecticut, Norway is the number one source of foreign goods. A major contributor of Norwegian imports is Norseland Inc (click here for Bridgeport MSA Trade Profile).

Norseland Inc Imports to the United States: Sources and Commodities

Because Norseland Inc is a foreign cheese importer, naturally their exports out of the States are zero. In 12 months the estimated value of imports brought into the States by Norseland Inc was 41 million dollars, arriving in 651 shipments from 8 countries. Of course Norway was the largest source of product with an estimated value of 21.7 million dollars. Spain was the second largest sources with an estimated value of 15 million dollars and then Ireland was third with 5 million dollars worth of product. All products arrived only a few miles south of the Norseland Inc’s headquarters in New York. Cheese HS: 0406 was the largest import, accounting for more than 38 million dollars worth of the imports.

Top countries sources of United States imports of cheese from Norseland Inc over one year list chart by estimated value and shipments

Top port of Norseland imports arriving in the United States and top commodities by estimated value harmonized code product description with shipping details

Norseland Inc Cheese Suppliers

By looking at specific Bills of Lading we can view specific company sources of cheese for Norseland Inc. Tine is the most recent supplier from Norway and here is a link to their website. The most recent supplier from Spain is Lacteas Garcia Baquero. The most recent supplier of cheese from Ireland is Dairygold Food Ingredients. In depth supplier source information is made available through PIERS Prospects. Below is the part of each Bill of Lading that documents the supplying company.

International Trade Report: Product- Heavy Construction Equipment; HS 8249

HS Code 842959 (Mechanical shovels, excavators and shovel loaders) is one child category under HS 8429- Heavy Construction Equipment (Stats Plus).  A complete hierarchical construct of the “family tree” is available at U.S. Census (2).  Precisely the category is described as “Self-propelled bulldozers, angle-dozers, graders, levelers, scrapers, mechanical shovels, excavators, shovel loaders, tamping machines and road rollers”.

Wikipedia provides an interesting history and types of Heavy Equipment as well as a list of notable manufacturers.  The use of heavy equipment has a long history. The ancient Roman engineer Vitruvius (1st century BCE) gave descriptions of heavy equipment and cranes in ancient Rome in his treatise De architectura. The pile driver was invented around 1500. The first tunnelling shield was patented by Isambard Kingdom Brunel in 1818. Click to view the article. (3).

From a bird’s eye view, Japan reigns with over $12 billion exports, commanding a 28% global market share.  Leading importers include China, Canada, United States and Germany.  The overall global demand appears to be quite spread out with the largest buyer accounting for only 7% of total imports.

China & Hong Kong dominate Japan’s exports with 36% between them.  However, Japan has also garnered many developing markets in their export mix including Vietnam, Indonesia, UAE, Russia and Thailand.

The U.S. imports 50% (over $1 billion) of all their Heavy Construction Equipment from Japan.  Other, secondary sources include Brazil (11%), Great Britain (8%), Korea (8%) and Sweden (7%).

Notwithstanding, the most significant U.S. import growth (from 2009 to 2010) was from Sweden (more than doubled), Great Britain (189% growth) and (Japan (111%).  Canada had the most notable decline as a source for U.S. Heavy Construction Equipment with a 78% decrease!

The United States exports a considerable amount of this product as well.  Canada purchases over $2 billion (52% of U.S. exports), followed by Mexico, Australia, Columbia and Chile.  Significant growth in U.S. exports to our Latin American neighbors should be noted particularly in Chile (153%), Brazil (106%) and Peru (73%).  Russia can’t be ignored either as the market almost quadrupled within one year.

From a state perspective, Illinois ranks #1 (27%) as the leading exporter of Heavy Construction Equipment followed by Texas (10%) and Iowa (8%).  The included chart lists the top ten Illinois manufacturers, distributors or exporters.  Of interesting note is Komatsu with two locations – Rolling Meadows and Peoria.

Although Komatsu is a foreign-owned (Japanese) manufacturer; U.S. trade statistics (from Census) and other trade intelligence sources (such as waterborne shipping detail from Customs) count its imports into the U.S and its exports out of the U.S. as “domestic”.
International Trade Report: Metro- Chattanooga & Company- Komatsu

Chattanooga Metropolitan area is ranked 97th in the United States with a population of a little over half a million inhabitants (1).  Chattanooga’s exports have almost doubled over the last half-dozen years; rising from $540 million in 2005 to $504 million during the first six months of 2010 (2).

As the accompanying chart illustrates, Machinery and Chemical Manufacturing represented the lion’s share of recent exports with $144 million (28.6%) and $138 million (27.4%) respectively (2).

The APEC countries (3) were the largest recipients of Chattanooga’s exports with almost $350 million followed by neighboring NAFTA countries (Mexico & Canada) (2).  Chattanooga does very little trade with either the EU (European Union) or Africa (less than 20% of the total).

Looking closer at Chattanooga’s trading profile reveals a more granular perspective (4).  First off, one of the top noted product categories is Toys (Harmonized Code 950390) for both import and export activity.   On the import side, we also see furniture (HS 9403), auto parts (HS 870899) and machine parts (HS 848590).  On the export side, electrical parts for machinery (HS 854800), Food Stuffs (HS 210690) and Heavy Construction Equipment led the way.

On the receiving side, Chattanooga’s imports from China, Germany and England flow primarily from Ports of Savannah, Charleston and Los Angeles.  On the export side Chattanooga primarily utilizes Florida ports for its shipping requirements.  The trade intelligence application (Prospects) (4) lists 325 importers including 133 companies for which there is detailed information on their specific shipments.

A review of these importers reveals that Komatsu is (by far) the leader of the pack with $670 million dollars of imports over the last 12 months.  In fact, as the chart below indicates, the next nine ranked importers don’t equal Komatsu’s trade total.

Komatsu America (www.komatsuamerica.com) is a manufacturer of full range Construction, Mining, and Compact Construction equipment including crushers, dozers, excavators, graders, shovels, trucks and wheel loaders.

Komatsu America operates a network of 12 facilities in US and Canada dedicated to the manufacture, marketing, financing and distribution of equipment and parts for the North American market.  Chattanooga is the home for one of its primary manufacturing plants with hundreds of distribution points throughout the U.S. and Canada.

Not surprisingly, most of Komatsu’s $670 million imports ($609 million of it) came from Japan in 5,630 shipments (of the 5,983 total) through the eastern ports of Savannah and Baltimore.  The primary product they shipped in (declared value over $170 million) was HS Code 842959- Mechanical shovels, excavators and shovel loaders. It represented 28% (1,724) of import shipments totaling 38,863 metric tons.

Comprehensive detail of Komatsu’s last 5,983 shipments for the last 12 months is available for download via the WorldTradeDaily.com Google Docs site.  Download complete Shipment detail here.

WTD Editorial: The Original “Letter to Stakeholders” and WTD Launch.

The following are excerpts from a letter sent to CenTradeX stakeholders and associates regarding the closure of CenTradeX and the launching of WorldTradeDaily.com.

The Global financial meltdown of late 2008, wreaked havoc in many industries and was particularly acute within the International Trade arena.  Prior to this devastating economic earthquake, CenTradeX was poised to experience skyrocketing growth via a promised capital infusion from a prestigious Venture Capital group.  In the wake of this severe financial crisis, CenTradeX, Inc. saw a dramatic decline in sales with corresponding operational difficulties which ultimately resulted in an acquisition of its innovative trade applications, clients and virtually all core technology personnel by UBM Global Trade/PIERS in May, 2010

Notwithstanding, many core technological assets were retained such as:

  • The A.I. (Artificial Intelligence) Engine which normalizes and “magically” integrates many disparate sources of trade related data.  
  • The vast data repositories containing decades of statistical, company, product information as well as the daily import waterborne manifests from U.S. customs and 5 years of transactional import & export data from China.  
  • The UBM deal also allowed for redistribution rights to 12 licenses of each of the three primary applications acquired from CenTradeX by PIERS; namely Prospects, StatsPlus and Dashboards to July, 2015.

I’ve always had more of a bent toward innovation, application development, education and philanthropy. Those who know me well know that I’m a person driven by passion, vision and mission, not just money and business as a review of my bank statements can attest.  The sale of CenTradeX allows me to focus my energies within the non-profit, educational sector, where my heart is.

My intention is to leverage the retained core assets mentioned (and into which over $1,000,000 has been invested over the last 10 years) along with my personal expertise, knowledge and passion for world trade to develop an interactive virtual community of trade data users, suppliers, educators, consultants and data-philes @ WorldTradeDaily.com.

WorldTradeDaily.com (WTD) will focus on issues relating to World Trade Data, information technologies and business applications. As a non-commercial forum, WTD will provide a forum for non-bias feedback on new products and applications.  It will encourage a free exchange of ideas,  facilitate connection, provide information and direction, and enhance the World Trade Community.

Another aspect of the vision is to provide free open source access to our vast data repositories and advanced technologies. We also intend to facilitate continued development, innovation and expansion of these available assets. This provocative approach is certain to cause quite a stir within the commercial sector!

As you know, providing free access really isn’t “free”.  At this point, the data is already a year or two out-of-date.  Ongoing data acquisition and handling, web site hosting and hardware /software maintenance will run $100k+ out-of-pocket per year. Also, not being independently wealthy, I need to develop an income stream to provide for me and mine.  So, I am looking to garner sponsors/advertisers/underwriters to help support WorldTradeDaily.com, both via in-kind contributions, or cash, or both.

We believe that the combination of open source free access to valuable databases and technologies, interesting daily publications by credible authors in the field, the unique needed focus of the forum, as well as social marketing could over time make WorldTradeDaily.com not only popular but vital.

A longer article with (almost) no pictures.  Not typical. Notwithstanding, I thought it apropos to restate publicly my original vision and intent, at this, the close of the first year of publication.

Special Report: Video Library of Trade Information Providers

WorldTradeDaily.com maintains a large collection of videos produced by various Trade Intelligence and data suppliers.  These provide a good reference tool to help evaluate each respective information source. Videos from what I call the “Top Tier” Trade Intelligence providers can be found here.

Up until now, we had been utilizing the VODPOD widget for the WordPress.com interface, but found that it significantly increased the loading and thus wait time for our readers.  On the other hand, it displayed a lovely graphic representation of six of the 150+ videos we currently maintain.   Alas, the ongoing conflict between the artist and the engineer part of me resulted in the elimination of the widget in favor of less graphic oriented navigational links located on the header bar at the top of the site. Therefore, I am writing both to notify readers of the change as well as to draw special attention to this resource.

Our current collection is divided between 12 categories or channels.  This repository is still maintained at VodPod.  The links below will take you to the respective channel.  As mentioned, the links are also located within the header bar under Video Library.

  1. Umbrella VodPod category of all videos and all channels: WorldTradeDailycom
  2. PIERS (UBM Global Trade).  6 videos: 3 each of hi-res and standard resolution versions: …/PIERS
  3. Datamyne.  10 videos but many are produced by some customer or data geek. …/Datamyne
  4. Zepol. A dozen fairly well produced videos featuring various aspects of their product.  …/Zepolvideos
  5. Panjiva. Great blogger but could only find one video which is in a one minute promo spot.  …/Panjiva
  6. Import Genius.  8 videos including several “case” studies from actual customers as well as “how to apply the data to do “X”.  Good approach. Not just “promotion” or “how our product works” type of videos.  …/ImportGenius
  7. Market Access Map (offered by the International Trade Centre- ITC) is an interactive utility for “making import tariffs and market access barriers transparent”.  Their collection of 13 videos are intended to train users.  …/maketaccessmap
  8. Trade Map (also by the ITC). “Trade statistics for international business development.” 8 videos. …/itcvideos
  9. Investment Map (also by the ITC). Interactive utility “for better foreign investment attraction and targeting.” There are 8 training videos. There are also other resources available at the ITC website that are worth checking out.  …/investmentmap
  10. U.S. Commercial Service.  5 “testimonial” videos, several “how to make international sales” ones.  …/commercial service
  11. Misc. TI Videos.  Currently 3 videos: one about the WTCA and 2 about HS Classification.  …/miscTIvideos
  12. Personal Views: Last, and perhaps least, is one solitary satirical video which reflects my personal view of the typical approach taken by TI providers, analysts and users toward the U.S Customs Waterborne Import BOL data.  Originally it was a Powerpoint I used in a presentation made at the now defunct ITDU (International Trade Data Users) conference in D.C. to a mixed reception.  …/worldtradedaily

Please let us know if you know of any videos that you would recommend for our library.