

 04/07/2013
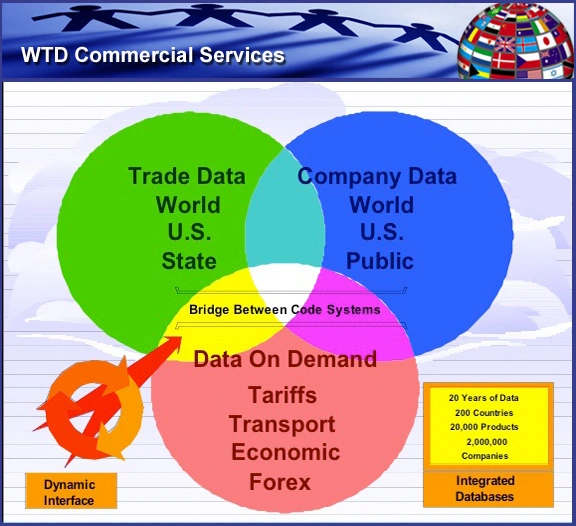
It all starts with the data. Data is THE fundamental building block used in constructing Trade Intelligence. Trade Intelligence, in one form or another, is the guide map used to navigate trillions of dollars of exchanges in goods and services by every year. WorldTradeDaily.com is dedicated exclusively to the matter of Trade Intelligence.
Let’s take a look at Global Trade Flow Statistics particularly merchandise (versus services) trade. First of all, it’s easy to forget when looking at the numbers, that beneath all the digits and commas are real people, companies, jobs, business relationships, political agendas, and the prosperity (or lack thereof) of countries and regions.
Specifically, Global Trade Flow Statistics, organized within the hierarchy of roughly 6,000 commonly used and agreed upon product (HS) codes, track the imports and exports between each of 200 countries. The respective governing (and taxing) authority for each government collects, aggregates and (usually through an associated entity) disseminates statistical information on their trade activities at least once per year. Many, like the U.S. and Europe, release data monthly.
The numbers reflect the total import or export value for each of 6,000 (six digit HS) product categories, which of course is easily aggregated to the four-digit parent grouping (around 1,200) and the 90+ (two digit) grandparent classes. They also document the number of units sold, whatever type unit, item, case, container, pallet, or barrel is being referred to. Obviously, cost per unit can be derived from dividing the value by the number of units bought or sold.
You can obtain this information on virtually every country on the planet with a few exceptions. For instance, Taiwan is not officially recognized by the United Nations as a separate country for publication purposes. You won’t find Palestine’s imports and exports either. The U.S. releases trade flow statistics every month trailing around 45 days. For handfuls of developing countries you may have to wait a year or two before you see trade figures.
Some countries maintain their own special rules for what they consider a documentable (and therefore reportable) export or import. Of particular note are China and several Middle East countries. China doesn’t report products manufactured and exported by foreign-owned companies as exports. Therefore, you will quickly discover HUGE discrepancies between what China reports they export to –let’s say the U.S. -versus what the U.S. proclaims they import from China.
Consequently, the truth about burgeoning trade deficits and trade imbalance along with the associated political and economic bantering about such things, needs to be reviewed in the light of underlying definitions. It is said, “Information is power”. Many of the specifics about trade transactions are carefully guarded government secrets. China, Inc. is closer to true than not.
The reality is that International Trade is the indisputable foundation for economic growth and prosperity. Global Trade Flow Statistics aren’t just obtuse and academic, they are historically relevant, currently pertinent and provide clues to future opportunities and trends that can inform and prosper the wise.


Comments are closed.