Archive | August, 2012

WorldTradeDaily.com Completed Its First Year of Publication. What’s Up for the Coming Year?

We concluded our first year of consecutive daily publishing with the announcement of a new format and focus: We’re going to be conducting extensive coverage of the $2 trillion of annual U.S. Import Trade.

For the past 120 days, prior to our September 1st launch of WTD 2.0, while we are busily compiling the extensive background data required for this project (and looking for a commercial sponsor and University partner), we republished selected articles from the previous year.

Please check out the complete details in several of our recent articles:

However, over the last several months, in discussion with several of our advisors, we have further refined our intention.  Specifically, we want to address U.S. Waterborne Import Trade.  There are several reasons behind this decision.  First of all, two-thirds of all U.S. import trade is waterborne.  Secondly, transactional data is only available for waterborne imports.  Taken together with statistical and company data the three-fold combination is powerful.  Therefore, if we focus on U.S. Waterborne Import Trade, we will be able to provide granular shipment detail, lists of both foreign suppliers and U.S. importers as well as trend analysis and strategic statistical overview… in each and every article… comprehensively representing every significant imported (via Water/ by Vessel) product.

Our plan is that during the 250 or so weekdays (Monday – Friday) of the forthcoming year (commending August 1st), we will report on specific products and commodities within the major (4 digit) product groups (those exceeding $1 billion dollars).  There are 170 product groups (of the 1250 total) that fit within this threshold thus together our selected product groups represent over $1 trillion of annual U.S. waterborne import trade.

In each story, we will expand upon the highest ranked (by import dollar volume) 6 digit sub-category within its respective 4 digit (billion dollar) parent.  In cases in which a particular 4 digit product heading has more than one billion dollar 6 digit “child” subcategory, we will develop an article for that product as well.

The purpose behind focusing articles on the top ranked 6 digit codes is that it lends to the greatest amount of specificity and business application. By covering the largest couple of hundred products individually, we will develop – over the course of one year – the most comprehensive (and hopefully useful) detailed analysis of U.S. Waterborne Import Trade available.

Those 4 digit Product groups that fall below the billion dollar threshold will be covered in summary fashion within their respective HS section or HS chapter heading for which we plan to dedicate a couple of dozen additional stories.

The graph below depicts a sample of the products for which we will be developing individual articles.  We have intentionally groomed the list as to eliminate all but the top 6,000 plus HS 6 digit products.

Sample of U.S. Waterborne Import trade product groupings to be developed into individual articles

Under HS Chapter 20, “Prepared Vegetables & Fruits” (Approx. $6.5 billion total import trade of which $4.6 billion came via water):

  • 4 digit product group 2008 “Prepared Fruits & Nuts” is ranked in excess of $1 billion waterborne import trade but doesn’t have any billion dollar 6 digit “babies”; therefore we will choose one or     both of the largest sub-groupings (Pineapples and/or Citrus Fruit) to develop.
  • Apple Juice ($672,868,720) is the largest sub-category under 2009 “Fruit Juice”, therefore it will be the subject of an article.

Under Chapter 22 “Beverages & Spirits” we will develop a handful of articles.

  • For 2202; 220210 – “Flavored Waters” ($1,043,205,967 waterborne imports)
  • Under 2203; 220300 Beer ($1,703,419,096 waterborne imports)
  • Under 2208, there are two sub-categories of $1 billion each: Whiskies and Vodka. Therefore we will dedicate an article to each.

Chapter 24 Tobacco, although it generated $1,273,160,265 in Waterborne imports, doesn’t contain any 4 digit product categories in excess of $1 billion.  Therefore it will be covered in our HS section and HS chapter summaries.

Notwithstanding our focus on U.S. Waterborne Import Trade, we will continue to reserve weekend articles to pertinent international trade and economic news, op-ed pieces and articles contributed by our WTD community of readers.  That’s the plan for now.

WTD 2.0 Coming September 1, 2012 Will Focus on $2 Trillion of U.S. Import Trade Flows

All products that are traded internationally are categorized within a common taxonomy called the “harmonized system”  This hierarchical schema consists of 21 sections, 98 (2 digit) chapters, 1250+ (4 digit) product groups, broken down into 6,000+ commodities and products.  These identifiers represent the agreed upon common “international language” of product trade.  Beyond the above, each country maintains its own unique sub-classifications (8,10,12, 15 digits) which are utilized for organizational, policy and tax (tariff) purposes.

Behind the statistics, analyses and facts about a specific commodity or product category, there is a wealth of valuable related information which can be gleaned and expanded upon about the locales (economic impact on countries, cities, communities) and companies (specifics on the foreign manufacturers, U.S. importers and trade service providers such as ports, carriers and NVOCCs).  Over the previous year, we published dozens of trade reports featuring various aspects of this mix including metro, country, product, company and historic trends.  Click this link to view a summary of all trade reports written by Isaac Thompson, who interned for WorldTradeDaily.com during this last semester.

So the plan is to report on ALL $2 trillion of product inflows within one year.  How this breaks down is as follows.  Every 4 digit product group that exceeds $2 billion (representing 1% or more of the total) we will dedicate a specific article to.  There are over 160 (out of 1250+) of these. Together they represent over 80% of U.S. Import trade.  In addition, we will cover every 2 digit HS chapter along with their corresponding 4 digit product groups under $2 billion.  In cases where the trade volume of the 2 digit chapter doesn’t merit individual attention, we will group them together for representation in a section article.  Thus, within the 250 – 260 planned week day articles, we should cover all product categories.

Taken together, it will represent a comprehensive portrayal of U.S. import trade, trading partners, and marketplace trends.  Hopefully, it will provide significant strategic knowledge with valuable business application, globally.  This comprehensive, if complex portrait of U.S. Import Trade is available for download via our Google Docs site

If the project continues beyond the initial year we can develop articles on lower ranked product groups (in the $250 million to $2 billion range) within the U.S. Import Trade flow perspective. We could take an alternate point of view, perhaps focusing globally on products equalling or exceeding a particular value threshold.  We could revisit the same product groups by expanding upon the trading partners and supply chain aspects of each.  We could increase the specificity (down to the 6 digit HS level) of the articles and address products /commodities of a particular threshold or angle (such as exports by China or BRIC countries). We could cover the several $trillion in global “services” trade.  Obviously, our university partner and commercial sponsor  together with reader feedback and interest within the context of available resources, will help guide our direction.

WorldTradeDaily.com Concludes First Year of Publication with Launch of WTD 2.0

WorldTradeDaily.com celebrated its one year anniversary May 1st, 2012   365 days of consecutive publication.  During the year we have undergone several evolutions in focus, content and design.  The breadth and depth of our viewership has correspondingly enlarged.  Half of our readers live outside the U.S. from over 120 countries.  This is important to us, since we strive to maintain a global, non ethnocentric viewpoint and provide value to an international audience.

I launched WorldTradeDaily.com with several ideas in mind, some personal some commercial.  Commercially, I sought to extract value from the assets retained (database repositories, artificial intelligence engine, application licenses) following the UBM Global Trade/ PIERS acquisition as well as my consulting and application development services.  Personally, I sustain a passion for international trade, making an impact, creating cool technologies and applications, and working with talented people.  WTD provided a forum and platform to explore and promote those ideas and ideals.

What now?  Well, the ideas and ideals remain the same. We’d like to further enhance the content and expand the reach.  Finding an appropriate commercial sponsor and partnering University would accelerate the process to be sure.

We concluded our first year’s publication with interviews and observations from the 25th Annual NASBITE (National Association of Small Business and International Trade Educators) conference.  Throughout the next couple of months, we will republish selected articles from the previous year, while redesigning the website and restructuring business operations. Commencing in July/August, we intend to launch WTD 2.0.  ideally incorporating daily video stories in addition to new article content. WorldTradeDaily.com will remain true to its motto: “Uncovering and Reporting on the Stories Buried Within International Trade Data… Every Day.”

Throughout the subsequent year, we will report on Products–  at least during the 250+ week days (Monday – Friday) – while presenting pertinent international trade and economic news stories on the 100+ weekend days.

Specifically, we will dig deep into the $2 trillion+ of annual U.S. import flows. There are a number of reasons for this.  The U.S. market is considered one of the easiest markets to access for overseas suppliers.  Relevant information on what, how much, when is bought by who is very valuable information for existing or prospective foreign manufacturers.  Also, U.S. companies gain strategic advantage by sourcing well and keeping up to date.  In addition, a plethora of data exists – including U.S. Customs Waterborne Import Shipping Manifest data (which is transactional and daily)  – that can greatly aid in “uncovering and reporting” on the valuable “stories buried within”.  Lastly, there are a handful of valuable sources providing assistance and analysis on U.S. Exports, and not as many representing and looking at U.S. Imports and Importers.

The following are example of previous trade reports. Click on the image to view the respective article. Click this link to view a summary of all trade reports written by Isaac Thompson, who interned for     WorldTradeDaily.com during this last semester.

Banana Product Report

Atlanta Metro Report

Coca Cola Company Report

Tunisia Country Trend Report

Proposal for the License of World Trade Daily Database Repositories & Technologies

Recently, we have received several inquiries regarding the purchase of our database repositories and technologies.  Therefore, I thought it pertinent to publish one of our proposals as an example of several options we are able to offer.  Options outlined below range from the simple acquisition of parsed, normalized historical U.S. Customs data to the purchase /licensing and integration of our advanced Artificial Intelligence engine, accompanying technologies and related data repositories.

For an outline on the development of our innovative technologies check out this recent article. You may also want to check out our article on our database repositories and artificial intelligence engine.

Proposal for the purchase (licensing) of a complete duplicate normalized copy of the U.S. Customs AMS Waterborne Import Shipment databases. February 6, 2012.

We have used the actual cost of the raw data from U.S. Customs as a yard stick by which to establish valuation… without the attribution of processing, enhancements, related databases, or associated technologies.

The base cost of Raw Data from U.S. Customs/DHS for 1 year (365 days @$100 per day) is $36,500.  The complete historical CenTradeX /World Trade Daily Customs Data Collection- acquired and processed daily from January 1, 2006 through August 18, 2010- cost us $160,900 (1,690 days @ $100).

Based upon this cost-value assumption, we have established the following framework for (non exclusive) licensing /purchase.

Option 1. Acquisition of processed, parsed, normalized data in a relational database without the addition associated company or reference databases; i.e. AMSTradeDataImport, along with three sub-options.

a. 1 year data (365 days) @ 33.3% base cost = $12,045
b. 2 years data (730 days) @ 25% base cost = $18,250
c. Complete Data collection of over 4 1/2 years data (1,690 days) @ 15% base cost = $24,135*

*The third option “c” comes with complimentary licenses to the Stats Plus or Prospects trade application for one year, subject to the PIERS EUA.

Option 2. Acquisition of the above ALONG WITH associated relational reference tables and international trade company databases; AMSReporting2 and associated tables as required.**

Please note that this option is only available for option “C” (the complete data collection) and will be calculated @ 30% base cost of raw Customs data (double the 15% factor outlined in 1.c.) = $48,270 total. This figure represents the total cost for both the complete Customs data collection AND all associated reference  and company databases; NOT an amount added to the rate outlined in option “1.c.”

**Option 2 also includes a complementary one year PIERS license to either Prospects or Stats Plus as well as 20 hours of my consulting time on a complimentary, i.e. free, basis.

Option 3.  Licensing of our A.I. (Artificial Intelligence) Engine – along with all scripts, documentation and associated databases needed to import, process and normalize new Customs data and connect it to company databases and reference tables.***

This option is only available with the acquisition of the complete Customs data collection (“1 -c”) AND (Option 2) associated company databases; i.e. AMSTradeDataImport, AMSReporting2, and other files as required. Pricing shall be calculated @60% base cost of raw Customs data (double 30% factor outlined in option #2) = $96,540* total. Again, this is total cost, not a cost in addition to the amount outlined in options #1 & 2.

***Option #3 will include 2 complimentary three-year licenses (through June 30, 2015); one for Stats Plus and one for Prospects, subject to the PIERS EUA. In addition, this option also includes 80 hours of my consulting time, to be arranged within a mutually agreeable schedule.

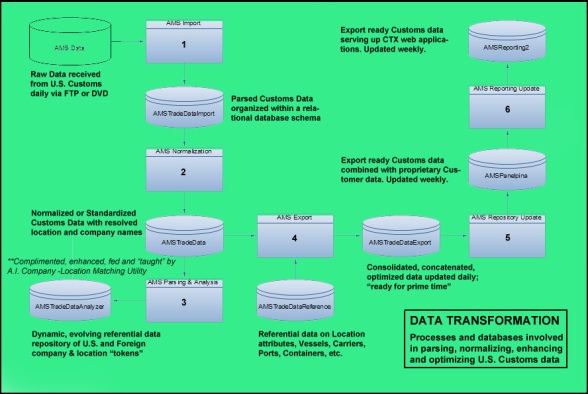
A fourth option, not outlined above, calls for the outright sale of our existing technologies and database repositories (on an exclusive basis) for $500,000.  Consulting and application development services, if required, would be additional.  Below, please find a diagram that depicts the process of transforming raw Customs data into Trade Intelligence.

  The Journey of Customs Data Transformation from Raw data to Trade Intelligence.

Solar Turbines Exports: Countries of Destination and Top Commodities

This report covers Solar Turbines Inc. one of the largest exporters in the U.S. and a wholly owned subsidiary of Caterpillar Inc. We cover export shipments by destination and value. We finish with an example of the top commodities sold by Solar Turbines.

Solar Turbines Inc.

Solar Turbines Incorporated was 44th on the Fortune 500 list in 2009. Solar Turbines was bought by Caterpillar in 1981 and has roughly 5,500 employees. The main products that Solar Turbines produce are axial-flow industrial engines. Solar Turbine has more than 13,000 gas turbine systems. Some of the more popular products are called Saturn, Centaur, Taurus, Mars, and Titan. Solar Turbines products are used in oil and gas production and transmission, and power generation. The gas turbine engines range from 1600 horsepower to 30,000 horsepower.  Solar Turbines is one of the 50 largest exporters in the United States and is located in San Diego (click here for San Diego trade profile).

Solar Turbines Inc. exports by country, rank listed by estimated value. Top buying countries are Venezuela, India, Nigeria, and Belgium.

Solar Turbines Inc. exported over 145 shipments from April 2011 to January, 2012. These exports had an estimated value of over 82 million dollars. They went to mainly 11 countries. The largest buyer of Solar Turbines by worth was Venezuela, buying 28 million dollars worth in this time frame. The second largest buyer was India, who bought 15.9 million dollars worth. The third largest buyer was Nigeria and then Belgium. These four countries alone generated 84% of Solar Turbine’s export sales. Please note the table with the buying countries rank-listed by estimated value, followed by a pie chart / graph. The pie chart percentages represent the percent of total value exported to buying country.

Pie Chart of Solar Turbines Exports by country and percentage of total export value

Solar Turbine’s Exports by Commodity Value

Using a comprehensive data set of all 146 export shipments, 146 Bills of Lading, available here, we created a graph of the commodities sold by value. We found that the commodities matched the list provided by the company. The top commodity sold was HS: 850230, Generating Sets. This commodity generated 30 million dollars of sales from April 2011 to January 2012. HS: 841181 Gas Turbines of a power less than 5000 KW were exported for 15.9 million dollars. HS: 840790 Spark Ignition Rotary Combustion Engines provided another 11.3 million dollars in overseas sales. Below is a bar graph showing the major commodities by value.

   Bar Graph of Solar Turbines Exports of Generating Sets, Gas Turbines, Spark Ignition Rotary Combustion Engines export estimated value from April 2011 to Jan. 2012.

Coca-Cola: Imports by Origin, Commodity, and Shipping Trends

This report gives a brief on Coca-Cola imports. We document Coca-Cola’s imports to the United States by origin, commodity, and date received. We finish by offering a downloadable dataset of  Coca-Cola’s 11,003 BOLs covering 2011.

Coca-Cola

Coca-Cola is the best-selling soft drink in most countries and was recognized as the number one global brand in 2010. The Coca-Cola Company’s world headquarters is located in Atlanta, GA (click here for trade profile). Coca-Cola produces over 500 brands including: Coke, Diet Coke, Fanta, Sprite, 7 Up, Minute Maid, and Simply Orange. Coca-Cola employs around 139,000 people worldwide. According to the 2007 Annual Report, Coca-Cola sold 42% of its product by gallon in the United States and 37% in Mexico, India, Brazil, Japan, and China. The remaining 20% was sold throughout the rest of the world.

Coca-Cola Imports to the United States

Coca-Cola imported 1.4 billion dollars worth of product from December 2010 to December 2011. 11,003 shipments carried the products to the United States, 11,001 coming from Puerto Rico. Puerto Rico was the major source of Coca-Cola’s imports to the United States in 2011. 99% of these shipments arrived in Jacksonville, Florida.

  Imports of Coca-Cola from December 2010 to December 2011, country of origin and port where received

Coca-Cola Imports by Commodity

With PIERS Prospects we can break down these 11,000 shipments into imported commodity and estimated value. Drink mixtures, HS: 330210, by definition of the United States Census, odoriferous (distinct smelling) substances and mixtures of raw materials or preparations to be used for the manufacture of beverages, accounted for 4,000 of the shipments. Drink mixtures from Puerto Rico accounted for over 99% of Coca-Cola’s import value. A more detailed commodity description is available on the individual BOLs.  It states that these are beverage ingredients, phosphoric acid solutions, and bottler flavoring compounds.

Top Commodities imported by Coca-Cola in 2011 from Puerto Rico

Complete Coca-Cola BOL Dataset and Shipping Trend Chart

We can also view the data in the form of trends. Below is a line chart with the Coca-Cola shipping trends from Puerto Rico. It shows that March is the heaviest shipping time. For the complete dataset of Coca-Cola’s 11,003 shipping records, click here.

Line Graph:Chart Coca-Cola imports 2011 from Puerto Rico by month and number of shipments

Phoenix, Arizona: Metro World Trade Profile and Top Importers

Phoenix, Arizona MSA Companies

Phoenix, Arizona is United State’s sixth most populated city. Phoenix’s Metropolitan Statistical Area (MSA) is known as the Valley of the Sun and has a population of 4.2 million people. Phoenix, the  capital city of Arizona and home to Arizona State University, has many government supported employees. It is also home to a number of Fortune 500 companies such as: Allied Waste, Avnet, Apollo group, Freeport-McMoRan, PetSmart, Pinnacle West, and US Airways Group. Best Western and U-HAUL have headquarters in Arizona, while Intel and American Express both have a major presence in the city. Click this link for a full list of corporations that have a notable presence in Phoenix.

Exports

Phoenix MSA exports 18.6 billion annually, placing them as the 15th largest MSA exporter by value. 10% of the Gross Metropolitan Product is exported, supporting 150,000 jobs. Brookings Institute. International Trade Administration groups products by category. According to ITA, Phoenix’s largest exported product cluster is Computer and Electronic Products composing 46% of the total. This one category accounted for 2 billion dollars worth of exports in just half of 2010.

   Phoenix-Mesa-Scottsdale Arizona exports 2010 first half computer naics metropolitan exports billions chart graph pie computer electronic product manufacturing, transportation, machinery, chemical

Specific Companies’ Data 

With PIERS Prospects we can find specific Phoenix MSA importing and exporting companies. This data is made available for the specific location of Phoenix, Arizona. The top Phoenix importing companies by value are Conair, Petsmart Inc, Omnimount Systems, Asa Solutions, Alliance Beverage Distribution, and Intel Corporation.  Below is an excerpt from the excel master file with this information. The data sets include Phoenix MSA company names, street addresses, import and export values, commodity names, foreign sources, and more. Contact WTD if you have any questions. Click here to download the entire data set.

Top importers in Phoenix Arizona metro statistical area by value: Conair, Petsmart Omnimount, Asa, Alliance Beverage, Intel, Rockford, etc. waterborne foreign trade data excel file raw available download clip

Bridgeport, Connecticut MSA, World Trade Snapshot

Bridgeport, Connecticut MSA Trade Snapshot 

Bridgeport, Connecticut is located mainland, north, above New York City. Bridgeport is the center city of the larger Metropolitan Statistical Area (MSA) including Easton, Fairfield, Monroe, Stratford, and Trumbull. In 2009 this area was home to nine hundred thousand people, making it the 41st largest urban area in the United States just behind Austin, Texas.

Once a hub of industrial manufacturing, Bridgeport suffered deindustrialization during the 70s and 80s and subsequently altered markets. Bridgeport’s MSA today exports about 7.5 billon dollars worth of products annually, which ranks it as the 35th largest MSA exporter in the United States. 12% of the gross metropolitan product is exported.

Bridgeport’s Exports by Product Cluster

During the first half of 2010, 4.3 billion dollars worth of exports were sent out from Bridgeport MSA. The largest industrial cluster was chemical manufacturing, making up 21% of the total exports at a value of 900 million dollars. Transportation Equipment Manufacturing (15%) was the second largest, sending out 655 million dollars in the 6 month span. 2 billion dollars worth of Bridgeport’s MSA exports (51%) were comprised under the International Trade Administration’s (part of the U. S. Department of Commerce) manufacturing category of other.  A majority of Bridgeport exported products do not fall under a single NAICS. With PIERS we can get a clearer picture of what comprises “other”.

Bridgeport MSA Exports by Product Cluster NAICS export profile Equipment Manufacturing pie chart International Trade Administration U. S. Department of Commerce

Top Industries in Bridgeport MSA by Number of Shipments

With PIERS Prospects we can look at Bridgeport MSA shipments by umbrella standard industrial code (SIC). The top industry by shipments is paper mills, SIC 2621. Cutlery SIC 3421 is the second largest, followed by manufacturing industries SIC 3999, and then electric housewares and fans SIC 3634.

Top Industries in Bridgeport MSA by Number of Shipments chart standard industrialized code paper mills, cutlery manufacturing CT Connecticut table

Bridgeport, CT bucks the major national import trend of relying on China as the largest supplier of goods. If we look at shipments coming into the Bridgeport MSA by country, the number one country is surprisingly Norway. China is the second largest source of shipments arriving in Bridgeport, followed by Germany, France, and then Hong Kong. Since Norway is an unusual first place source for imported goods, it deserves a look into what kind of products and companies are shipping from Norway.

Top shipments by country into Bridgeport MSA 2010 2011 Greece, Hong Kong France, Germany, China, Norway imports container companies PIERS Prospects chart list

Top Companies Importing Norwegian Goods into Bridgeport MSA

With PIERS Prospects we can also view companies importing goods into specific United States locations by country of origin. In this case Norway was the number one source for imported goods into the Bridgeport MSA. The largest company bringing in these goods was Norske Skog (Usa) Inc. Their main product is paper which matches our industrial report above. There were more than 300 shipments of pure paper to Bridgeport from this one company. The second largest company was Norseland Incorporated which imports mainly cheese. With PIERS we can gain a much more in depth view on virtually any of these companies to include shipping trends, sources, bills of lading, executives, location, etc. Below are the top Norwegian companies importing into the Bridgeport MSA.

Norwegian companies importing into the Bridgport MSA shipments Teus rank bill of lading shipping trends 12 month company Norske Skog Norseland Incorporated chart list

Bananas, HS Code 0803; Import-Export Profile of Global and U.S. Trade

Bananas

Bananas, HS code 0803, are an essential part of many American’s diet, yet these fruits grow in the tropics and must be shipped a long distance to world markets. The United States only produces .008 million metric tones of bananas a year. India, the world’s leader, produced 26.2 million metric tones of bananas in 2009.

Top world producers of bananas by country 2009 India, China, Brazil, Costa Rico chart

They are followed by the Philippines, China, Ecuador, Brazil, Indonesia, and Mexico. Costa Rica is the world’s eight largest producer of bananas and Whole Food Market Inc main supplier (click here for Whole Food Market’s Import Trade Profile).

 Top Exporters of Bananas by Country

Ecuador, the fourth largest producer of bananas, is the world’s top exporter, consuming 43% of the world’s market. In 2009 alone Ecuador secured 6.66 billion dollars worth of banana sales abroad. Colombia, Ecuador’s closest neighboring country and the ninth largest producer, was the world’s second largest supplier of bananas, accounting for 25% of the world’s foreign banana market with a 3.8 billion dollar worth. Philippines is the only other country pulling in more than a billion dollars of banana sales per year, accounting for 19% of the world’s market.

World’s top banana exporters by country: Ecuador, Columbia, Philippines pie chart graph percentage 2009 dollar amount shipments annual

World’s Top Banana Importers

Ever wonder where all those bananas at the market come from? Well the United States is the world’s largest importer of bananas. In 2009 alone the United States spent 3.1 billion dollars on foreign bananas. United States bought 20% of all the world’s for-sale bananas. Other northern industrialized nations followed. Germany imported 12% of the available bananas, Italy 8%, Russia and Belgium 6% a piece, Canada and the Netherlands 5% a piece, France and the United Kingdom 4% each, and Japan 3%. Just these 10 countries make up 75% of the world’s banana buying market.

Seventy-five percent of the world’s import market bananas by country United States com trade pie chart Germany 2009 dollar amount graph

The United States receives 96% of its bananas from South America. This is not surprising since the strongest banana world growers and exporters are located there. Also notable is the relatively short distance from South America to the United States. The estimated 2010 value was 1.7 billion dollars of imported bananas from this region. More interestingly we can gain access to the top companies selling bananas to the United States. Using PIERS Prospects we can pull up the top 26 companies exporting bananas into the States. We can see that the largest company is Union De Bananeros Ecuatorianos Sa. We can view individual companies’ telephone numbers and address. Within the program individual company profiles also exist. Provided for your convenience is an excel data sheet filled with leads of companies. The top banana sellers exporting to the United States are all in this file (download here). This data set includes sales, phone numbers, number of employees, company presidents, etc.

Top foreign sellers of bananas companies by region value to United States imports data shipment waterborne value money sales list

Whole Foods Market Inc: Trade Profile and Import Sources

Whole Foods Market Inc

Whole Foods Market Inc is a company that is devoted to offering untainted whole foods. The premise of the company stands on giving people an alternative to buying processed foods. It boasts supporting local growers and local producers by offering these local goods at a large retail market. Founded in 1980 in Austin, Texas (click here for Austin Trade Profile) Whole Foods has more than 310 stores in North America and the United Kingdom. Its headquarters is still located in Austin, Texas.  2007 Fortune magazine ranked Whole Foods Market as the 5th best company to work for. Because of the company’s stance on local food production, it is interesting to see where the main shipments of imports come from and what they are.

Whole Foods Market Imports by Country

With PIERS Prospects we are able to see where goods are from, what is in the shipments, and where they land. Aggregated, we can analyze trends. Between November 2010 and November 2011 Whole Foods Market Inc imported 376 waterborne shipments with an estimated value of 9.4 million dollars. Costa Rica and Italy were the top sources for imported products. Costa Rica sent 260 shipments with a value of 1.2 million dollars and Italy sent 86 shipments with an estimated value of 7.9 million dollars.  Freeport Texas receives 37% of these shipments, while Philadelphia receives 32%, and Long Beach, California receives 19%. Complete excel data sheets are available in any one of these categories.

Costa Rica and Italy’s Shipments to Whole Foods

Costa Rica shipped substantially more than Italy at 260 shipments verses 86 shipments, yet Costa Rica’s estimated value is almost 7 times lower than that of Italy. Obviously Italian products shipped were worth more than Costa Rican products. When we compare the two countries’ shipping records side by side, we see that Costa Rica only supplies bananas and plantains, while Italy supplies mineral water, salt, orange juice, and essential citrus oils. If you would like your own copy of the excel data file for Costa Rica’s exports to Whole Foods Market click here, for Italy’s click here.

Whole Foods Market Inc top countries of import United States, Costa Rica, Italy, France shipments plantains, banana, water estimated value 2011

Water mineral Italy shipments to United States import market Whole Foods Inc

Computer Hard Drives: Export/Import Profile of Global and U.S. Trade

Hard Drives

Integral to almost every computer is a hard drive.  Hard drives write, store, and retrieve digital information usually on a disk. These disks are coated with shiny metal that the computer writes on and later can access. Hard drives’ capability and speed have drastically increased over the years while production costs have reduced. Examples of external hard drives are iPods, storing 160 GB a few years ago, and thumb drives. This integral part is in almost every computer.

Hard Drive World Market Exporters 

The top hard drive exporter is China with 16.8 billion dollars worth of sales in 2009. China sells 31% of the world’s hard drives market. Tech savvy Thailand comes in second, securing 16 billion dollars worth of hard drive sales in 2009, making up another 30% of the market. United States is the sixth largest distributor of hard drives, bringing in 2.6 billion dollars from foreign sales in 2009. United States is represented by dark green in the pie chart below.

Hard drive sales world top exporters China Thailand software hardware computers CPU personal external internal United States dollar value market percentage pie chart

World’s Top Importers

The world’s top importer of hard drives is also China. China spent 10 billion dollars on foreign built hard drives in 2009, buying 19% of the internationally traded commodity. United States was the second largest buyer of foreign made hard drives, spending 9.4 billion dollars in 2009.

Top five world importers of hard drives CPU personal computers market dollar value country China United States dollar value percentage 2009

United States Hard Drive Sources

United States bought 83% of their foreign-made hard drives from 4 countries: China, Thailand, Singapore, and Malaysia. These 4 countries account for around $8 billion dollars worth of America’s foreign spending dollars which leave the shore. China is the largest seller of hard drives to the States. Thailand is the second largest. Since Thailand is geographically smaller and their population is substantially less than China’s, there are less Thailand companies. Yet Thailand’s sales to the United States almost equal that of China’s. Here is a list documenting the 17 Thailand manufacturers/dealers of hard drives selling to the United States. This list includes companies by name, addresses, phone numbers, city present in, postal code, employment numbers, and head directors names. If you wish a comprehensive copy of this list, please let me know, I’ll be happy to send it to you.

Western digital Thailand manufactures of hard drives employment records address company names age electronics co limited head CEO presidents compensation

Thailand’s Largest Hard Drive Manufacturer: Western Digital and its President 

John Coyne

Contrary to the company’s name, Western Digital is the largest hard drive company in Thailand. It is located in Bang Pa-In, central Thailand, and the name of the president is John Coyne. John is an anglo name, as is John himself. He serves as Chief Executive Officer.  Here is a link to his Forbes People Profile. John received 7 million dollars in compensation in 2010 alone.

Austin Based Dell Computers: Trade Profile & Import Shipments

Dell Inc

Dell Inc is headquartered in the Austin MSA (click here for Austin trade profile). Dell Inc is one of the largest technological corporations in the world employing more than 100,000 people. Dell Inc is the 41st company on the Fortune 500 list and the largest company in the Austin MSA area in Texas. It is also the second largest non-oil company in Texas behind AT&T. Although Dell’s Austin assembly plant was shut down in 2008, Dell Inc is still a large employer in the area. 16,000 people are employed at the headquarters. In 2008 Dell upgraded its headquarter’s power sources getting 60% from wind powered generators and 40% from landfill gas turned into energy.

Dell Inc Imports by Foreign Country

Using PIERS Prospects, we can examine waterborne Dell Inc imports. In the 12 month window Dell Inc brought in more than 932 shipments with an estimated value of 343 million dollars. Dell likes to assemble close to the point of delivery, so this probably accounts for the low export figure which is near 1 million dollars. China contributes 98% of Dell’s total imported shipments with an estimated value of 342.7 million dollars moving in 918 shipments. Since these shipments are mainly from China, they tend to arrive in California’s Los Angeles and Long Beach.

Dell Inc imports exports China CA 2011 shipments waterborne trade data value trends computer software

Dell Inc’s Top Imported Commodity 

Dell Inc imports a majority of HS code: 847120 digital automatic data processing machines with central processes. These input-output units are computers. They compose 75% of the total shipments and 309 million dollars of the total 343. The second highest import by value is HS code 847130, which is the same thing except portable: laptops. Other notable imports are parts and accessories for these computers and stands.

Dell inc top import commodities digital processing machine automatic laptops computers percentage china united states shipments

Dell China inc Computer Imports United States Chinese companies manufacturing computers laptops electronics trade partners

Dell Inc’s Shipping Records From China

Dell Inc gets 98% of their imported shipments from China. With PIERS Prospects we can view a complete list of waterborne shipment data, bills of lading, etc. Click (here) to download the complete excel file for Dell Inc’s imports from China from November, 2010 to November 2010. Another point of interest is a small list of some of Dell Inc’s Chinese trading partners. These partners act more as a source than a trading partner, since Dell only imports goods from China. The list of companies provides a direct link to sourcing and manufacturing of wholesale computers.  Click here to down load details of Dell’s shipment records. 

Austin, Texas – Metro Trade Data Report. Big in Electronics & Computers

Austin Texas MSA Trade Snapshot

Austin, the capital of Texas, is the 14th most populous city in the United States. Austin was the third fastest growing large city from 2000 to 2006. Austin is known as a popular music city strongly supporting arts and culture. Austin’s metropolitan statistical area (MSA) can also boast a strong economic sector.

export value Austin MSA Texas GDP rank 2008

Several Fortune 500 companies are present including Freescale Semiconductor, Forestar Group, Whole Foods Market, and Dell’s Worldwide Headquarters.  This five county MSA has a gross domestic product of $86 billion dollars and an annual export value of $10 billion.

Austin’s Exports by Product Cluster

Austin’s MSA has a unique product-export portfolio. During the first half of 2010, 53% of total exports were computer and electronic products (ITA). 36% of products exported were manufactured machinery. Paper and transportation equipment meanwhile accounted for 2% a piece of total exports. This unique profile highlights the importance of the computer and electronic manufacturing in Austin. This type of information is available to the public under the International Trade Administration and the U. S. Department of Commerce.

  Austin TX Round Rock MSA exports by product dollar percent 2010 first half

Austin’s Importing Companies

Using PIERS Prospects we can look at something not so readily available to the public: imports. There are 1,201 importing companies in the Austin MSA.  This chart gives us leads as to what companies are moving products into Austin’s MSA. Dell Inc is one of the heaviest importers with 343 million dollars coming in through shipments alone. Serengeti Trading Company, the coffee company, imports 61 million dollars of mainly coffee. Below is a list of the top 10 importing companies of the area.

Importers Austin Metro Stats Area Companies Dell waterborne shipment San Marcos Rolling Rock Texas

Using Prospects, one can expand the depth and breadth of vision into imports brought in to Austin’s MSA. A click reveals the top countries importing into Austin’s MSA. These countries are arranged by containers imported from November 1st, 2010 to November 1st, 2011 which is very recent in the import export trade data world. Most containers come from China, then Japan, Korea, and India. Within the program, each country can then be expanded to display exactly what companies are importing from this country.  In the last 15 days of data alone, Academy Ltd was the largest importer from China in Austin’s MSA. They received 99 shipments from China in these few days. Below are the two charts, documenting top countries of origin and top companies within those countries. Feel free to post a comment requesting additional data, especially from links in the pictures.

Trade countries shipping to MSA Austin San Marcos Texas 2010 2011 China Japan India Korea annual containers companies

Word count: 518 Draft saved at 3:37:32 pm. Last edited by Robert Thompson on Thursday, July 5, 2012 at 12:03 pm

Writing Helper

  • Copy a Post

    Copy a Post

    Use an existing post as a template.

Publish

Status: Published Edit
Visibility: Public Edit
Published on: Aug 19, 2012 @ 6:00 Edit

Categories

Tags

Tags


Separate tags with commas

X AugustX Trade Intelligence

Choose from the most used tags

Featured Image

Likes and Shares

 Show likes on this post.

 Show sharing buttons on this post.


Top 836 waterborne importers shipping from China to MSA Austin San Marcos Rolling Rock 2011

Nitrogenous Fertilizers HS 3102: Export /Import Profile of Global and U.S. Trade

World Trade Profile of Nitrogenous Fertilizers

Fertilizers are any organic or inorganic material added to soil to supply nutrients to plants which is essential for them to grow. 40 to 60% of crop yield can be attributed to commercial fertilizer. The most heavily used fertilizer is Nitrogenous Fertilizer (N Fertilizer), known by Harmonized Standardized Code (HS) as 3102 and Standardized Industry Code (SID) 2873. N fertilizer is a huge business. It has been estimated that just under half the people on the Earth are currently fed as a result of the use of synthetic nitrogen fertilizer.  Read the story.

World Use Trend of Nitrogenous Fertilizers

Another interesting aspect of nitrogenous fertilizer is the increase in worldwide use. Discovered in the early 1900s, nitrogenous fertilizer has exploded in use and has been a formable component of the world population growth.

We can see how in recent years the worldwide use of Nitrogenous fertilizer has expanded. It had grown from 40 million metric tons used annually worldwide to 100 million metric tons used around early 2000. Some of the biggest users are the developing Eastern Asia countries. In 2006 the Far East consumed 58% of the world’s N fertilizer while North America consumed 13%.

World’s Top Importers and Exporters of Nitrogenous Fertilizer

Today we can look at top world exporters and importers of Nitrogenous Fertilizer. We see that Russia is the top exporter by value, exporting 19% of the world’s share of N fertilizer and producing 4.5 billion dollars worth in 2009.  The Netherlands, Egypt, China, Canada, Saudi Arabia, and Ukraine all exported beyond 1.5 billion dollars worth in 2009.

United States is the largest importer of N fertilizer by value, spending an estimated 2.9 billion dollars in 2009. India, France, and then Brazil all follow United States importing over 1 billion dollars apiece annually.

United State’s Trade Deficit in Nitrogenous Fertilizers 2010 

An interesting tool we can use is the U.S. trade balance chart from StatsPlus, a PIERS product (see below for discount). This chart documents the most recent trade balance according to the U.S. Census. Total imports were 2 billion dollars more than United States exports. Since it gives us the dollar value by country that the U.S. exports to and imports from, we can see the trade deficit by country. The largest trade deficit is with Canada represented in yellow on the histogram. This deficit is followed by China and then Trinidad and Tobago. The U.S. spent almost 700 million dollars on Canadian nitrogenous fertilizer. In China and Trinidad and Tobago the U.S. spent about 300 million dollars in deficit per country. If you would like to read more about HELM, the main company importing nitrogenous fertilizer from Trinidad and Tobago to the United States, the information is available here.

  United State’s Trade Balance surpluses and deficits by trade United States trade partner countries in Nitrogenous Fertilizers 2010

Metro Trade Data Report: Tampa, Florida. Focus on Top Importer Helm Fertilizer

Based in Hamburg, Germany, HELM AG is a family owned business that was established 110 years ago. It is a worldwide marketing company that links foreign suppliers of goods to companies and countries in need. Helm is present in over 40 countries worldwide and specializes in chemicals, nutrition, fertilizer and crop protection, acids, and lyes. In 2008 HELM had 9.1 billion EURO turnover, the European term meaning revenue equal to the equivalent of 11.8 billion US dollars. Europe accounted for the majority of sales at 53% and America was second, accounting for 26% of the company’s total revenue.

HELM America Corp 

Helm’s United States headquarters is located in the New York City’s MSA and has a presence in Tampa Bay, Florida. Since this company is a major global force in fertilizer and chemical trade, it is a perfect company to research direct sourcing and resource location. Helm AG acts as the middleman between the resources and companies.

One of the largest features of HELM’s international organization is the fertilizer business. Since fertilizer is mainly a waterborne commodity it lends itself well to PIERS trade analysis. So what role does Helm play in the States? With PIERS Prospects we gain a clear picture of HELM’s Fertilizer waterborne imports and exports over a recent 12 month period, November 2010 to November 2011.

HELM America Corp Fertilizer Imports

Export data for HELM in the United States is almost nonexistent. Most of the trends show it shipping to other U.S. locations. What is strong is the huge amount of imported material HELM brings into the States. HELM imported an estimated 530 million dollars worth of commodities in the 12 month window. With Prospects we can dissect the imports by country of origin and top commodities.

HELM America Corp Imports by Country

Trinidad and Tobago were the heaviest source of imported HELM commodities. These little countries located south of Florida and Puerto Rico, yet close to the States (click for map) accounted for 70% of the total shipments. The second largest country for the origin of goods imported by value was Egypt with 45 million dollars, followed by Estonia and then Russia.

HELM America Corp Imports by Commodity

Prospects allows us to view the top commodities by shipments. Some of the top commodities can be shipped in one shipment but are very valuable, while others require a plethora of space and thus multiple shipments are needed to achieve substantial dollar value. The major commodity imported was HS: 310280, which is mixtures of urea and ammonium nitrate in solution. The umbrella code of HS: 3102 includes all mineral or chemical fertilizers.

HELM Bills of Lading from Trinidad and Tobago 

Trinidad and Tobago are the leading supplier of HELM imports to the States. When we look at the shipment record we can see shipping trends and bills of lading for each shipment. We see that all the shipments from Trinidad and Tobago are HS 310280 urea and ammonium and nitrate. When we look at the most recent BOL we see the shipper, vessel’s name, port, weight, and consignee, which is HELM. From this we can see the source or dealer of HELM’s fertilizer that is being sold in the States. Of course further research should be done on Trinidad, Tobago, available companies, and resources, but it is definitely a lead. Below is an example of the latest HELM BOL from Trinidad and Tobago.  Here is a link to the entire dataset in Excel format covering the last 12 months of HELM’s shipping imports from Trinidad and Tobago.  (Link to Excel data for 12 months of shipping data)

Metro Trade Data Report: Tampa, Florida. Top Exporters & Top Importers

Tampa, St. Petersburg, and Clearwater MSA Profile

Tampa is a large city located next to Florida’s Tampa Bay. Tampa’s Metropolitan Statistical Area (MSA) is a combination of Tampa, St.Petersburg, and Clearwater. Tampa Bay was ranked as the 5th best outdoor city by Forbes in 2008 and 12th of the 20 best places to live and work in America by BestJobsUSA.com. The Census Bureau estimated the MSA’s 2010 population as 4.2 million with around 70,000 new people arriving per year. 66,000 of these newcomers are immigrants, making Tampa MSA a U.S. hot spot for immigration. Tampa is the home of the Tampa Bay Buccaneers, The University of South Florida, and MacDill Air Force Base. Between the heavy military presence and the universities, there are strong research capabilities.

Tampa Bay’s history of manufacturing for the defense industry has created a highly skilled workforce, who are now employed in other industries like medical manufacturing. The bay itself is very shallow, less than 30 feet in many spots, which requires almost constant dredging to allow shipping.

The Port of Tampa is the largest port in Florida by tonnage and one of the busiest commercial ports in North America consisting of over 5000 acres. According to the Port of Tampa’s website, it has the economic impact of 8 billion dollars and 100,000 jobs. According to Brookings, Tampa’s MSA has an annual export of 7.9 billion which supports 74,000 jobs. Thus, between the two reports, one can understand the large amount of jobs created by waterborne imports and exports from the Port of Tampa.

Tampa’s MSA Top Importers

With PIERS Prospects we can look at a list of top importing and exporting companies in Tampa’s MSA. Prospects is based mainly on waterborne data, so it does not encompass all import and export data, but it supplies a picture and leads. Helm Fertilizer Corporation is the top waterborne importer, spending 500 million dollars on foreign goods. This number is from a 12 month range. Jabil, the electronic product company which has over 100,000 employees world-wide, is one of the largest importers in the region with around 154 million dollars worth imported in a 12 month span. Jabil is headquartered in Tampa’s MSA. Here is a list of the ten top importing companies bringing foreign goods into Tampa’s MSA.

Tampa’s MSA Top Exporters

The Tampa MSA is prime location for some heavy United States exports. In 2009 the top export destination was the Asia-Pacific Economic Cooperation (APEC). This trend was followed in 2010. The second largest destination of exports goes to the North American Free Trade Agreement (NAFTA). With PIERS Prospects we can view the individual companies exporting United States goods by company.

The top exporter is Dow Chemical Company with 2.5 billion dollars worth of exports. Gerdau, a Brazilian world leader in steel, who has its U.S. corporate headquarters in Tampa’s MSA, has an estimated 620 million dollars of exported material in the 12 month window. Because of the presence of international corporations, it becomes difficult to delineate true United States exports. Gerdau, for example is a Brazilian corporation. So the question must be asked, what do we label Gerdau’s exports? The classification of these variables can have a tremendous impact on import and export data. As it is now, Gerdau’s exports from the States are considered exports from the United States.  Included below is the Tampa-St.Petersburg-Clearwater MSA’s top export companies as well as its top export destinations.


Trade Data Report: Export /Import Profile of the Global and U.S. Plastic Footwear

Exporters of Footwear by Country

China dominates the market for all types of footwear selling almost 28 billion dollars worth in 2009. China alone accounts for 81% of the world’s exporting market in footwear sales. Vietnam, the world’s second biggest seller, generated 3.7 billion dollars worth of sales in 2009 and accounted for 11% of the world’s sales. China’s percent of the world’s export market in footwear is represented by the red slice in the pie chart.

 Rubber and Plastic Footwear

Rubber and plastic footwear, recognized in the United States by Standard Industry Classification codes SIC: 3021 and internationally as HS: 6402, include ski boots, snow boots, sports footwear, sandals, and all other plastic and rubber footwear. Denver (Click here for WTD Denver market profile) based Crocs (click here for WTD Crocs Inc. market profile) which became popular with their 2002 rubber foam cogs also falls into this product code.

Importers of Rubber and Plastic Footwear by Country 

As the table bellow displays, the top eight importers all spent over a billion dollars in 2009 on rubber and plastic footwear. The top importer of rubber and plastic footwear in the world is the United States. In 2009 the United States spent 6.5 billion dollars on foreign-made rubber and plastic footwear. The U.S. were buyers of 19% of all the world’s exported rubber and plastic footwear. The second biggest buyer of this commodity was Japan who imported less than half as much as the United States, consuming 8% of the market. Japan was followed by Germany at 7%, France at 6%, and the United Kingdom at 3.6%. It is plain to see that weather resistant footwear has found a replenishing home in Western and more developed countries, but these countries are unwilling to manufacture and produce it.

China’s Exports of Rubber and Plastic Footwear to the United States

China dominates the world market in the rubber and plastic footwear industry. Their exports are almost identical to the trend of the top importing counties, with most of China’s exports going to the United States followed by Japan and then Germany. Using PIERS StatsPlus we can gain a historic view of the imports to the United States of rubber and plastic footwear from China. The following graph shows the growth of this market by year. United States’ imports of rubber and plastic footwear from China has almost doubled from 2003 to 2010. China sold the United States 2.8 billion dollars worth in 2003 and 5 billion dollars worth in 2010.

U.S. Imports of Rubber and Plastic Footwear from China

Trade Data Report: Denver Based Crocs Inc.- Trade Profile & Shipments

Crocs Inc. 

Everyone has seen the shoe that is comfortable, rubbery, and colorful: the Croc. Crocs originated as a foam clog designed as a spa and boat shoe. The high versatility of this shoe shows excellent use in water environments. As a beach shoe, boat shoe, river shoe, it is nearly unsurpassed. The foam bottom is plastic which enables it to get wet and retain no liquid. This shoe, even thought it is viewed by many as ugly, created a major fashion following. As of 2007 Crocs had been trademarked in over 40 jurisdictions around the world, with its headquarters in Denver MSA (Click here for Denver MSA trade Profile).

Crocs Imports by Value and Country of Origin  

November 2010 to November 2011 is the most recent trade data available for Crocs Inc. PIERS Prospects showed a total of 18 million dollars of waterborne imports for these 12 months, occurring through 932 shipments. Download complete detail for these 932 Croc shipments. Crocs bought most of its imported commodities from China, with an estimated value of 18 million dollars, accounting for 98% of the total shipments. The Netherlands were the second country that Crocs bought from with a total of only 8 shipments valuing 144 thousand dollars.

Crocs Top Imported Commodities

The most imported commodity is HS: 3920 which are plates, sheets, or film of plastics, not reinforced, laminated, or combined with any other materials. These are plastics that can be used for the shoes. 71% of the total shipments were filled with this plastic, estimated at a total value of 13 million dollars. The second most imported commodity was HS: 640299, other footwear with outer soles and uppers of rubber or plastic. This commodity had 2.4 million dollars worth imported over the 12 months. HS: 640590 was the third most imported commodity which is uppers of textile materials. This product also had about 2.4 million dollars worth imported.

Crocs’ Shipping Trends

With Piers we can look at shipping trends by shipper, shipments by country, and individual bill of ladings. We can see how many shipments are coming by each company. The Look is the main shipper, only being surpassed by Crocs Inc. in May and June. With this 12 month data, we can tell shipping trends and make projections. We can also look at total shipments by shipper and date, with links to individual bill of ladings. Here are the shipping trends and the shipment details. A full excel data set is available at the bottom.

Trade Data Report: Export /Import Profile of the Global and U.S. Television Receivers

TV Receivers

Almost everyone has a television set but a television is virtually useless without a receiver. Who wants a TV that can get just 3 to 5 channels? Almost all sports, news, educational, and entertainment broadcasts are available only through attaching a receiver to your TV. Today it is almost impossible to have basic cable and view anything on that cable without a receiver. It is also impossible to view satellite steams without the receiver. These receivers are usually provided as part of a subscription to any major provider and thus taken for granted. TV Receivers are listed in the SIC as 3651 and the HS code as 8538. These codes are used to track foreign trade and are available from the U.S. Census Bureau.

TV Receiver Historical Production Trend

Although outdated, the following table shows the production of TV receivers by country and year. TV production after WWII was only present in Western counties. China did not make any significant amount of television receivers until 1978. After 1978 China’s growth in the manufacturing of TV receivers is exponential.  China grew from producing 1 million units in 1978, to producing 20 million units in 1987, and then to producing 42 million units per year by 1998. In 1978 China produced 14% of the TV receivers that the United States did but by 1987, 9 years later, China moved to producing 150% as many TV receivers as the United States. By 1998 China was producing almost 400% as many TV receivers as the US.

World TV Receiver Exports and Imports

As of 2009 China was the dominating TV receiver exporter, accounting for 22% of the world’s market, generating a staggering 28 billion dollars. Mexico was the second leading exporter generating 18 billion dollars and holding almost 15% of the world’s market. United States did not on make it to the top ten list of TV receiver exporters, as our production had actually declined from 1987. (See yellow on the graph above.) United States did show up on the top importers of TV receivers in 2009, with an estimated value of almost 25 billion dollars spent abroad for this precious commodity. We made up almost 20% of the buying worldwide. The top importing nations are interesting to note because they are all western countries. If compared to the historical production trends, it is plain to see that the countries that initially produced the product became the top users of it. They then outsourced the production of the receivers and became the top buyers. The top buyers of foreign-made TV receivers in 2009 were United States, followed by Germany, France, UK, and then Italy.

United States Trade Balance

With PIERS Stats Plus we can see in-depth charts and graphs available for products by country. A quick look at the United States trade balance of TV receivers reveals a major deficit. Our top positive balance is with Canada which accounts for almost 2 billion dollars in profit. Our most negative balance is with China in which we are more than 15 billion dollars in the red. Our relationship with Mexico is equally as dismal with a trade value deficit of over 14 billion dollar going one way to Mexico.

Trade Data Report: Denver Based Echostar Technologies- Trade Profile & Shipments

Echostar Technologies and Imports from Countries

Echostar Technologies, a large technology company, owns a fleet of satellites. Echostar Technologies is the parent company of Dish Network. It supplies Dish Network, the second largest pay TV provider in the United Staes, with satellite access, set-top boxes, and receivers. Echostar actually owns the technology side of Dish Network and has fifteen satellites in orbit, named EchoStar I, II, III, IV, etc. The spin-off of Dish Network occurred as recently as December 2007. EchoStar located in the Denver MSA (click here for Denver’s Market Profile) is the top importer in the area.

They have a 12 month estimated waterborne import value of 140 million dollars of material. With PIERS Prospects we can view the countries that these enormous amounts of imports are coming from. Out of the 140 million dollars worth of equipment,  China was the number one country that Echostar Technologies bought from, with an estimated value of almost 79 million dollars. Hong Kong, a city-state of China, accounted for the most other imports at 61 million dollars. It is safe to say that Echostar is getting virtually all of its 140 million dollars worth of imports from China.

Echostar’s Top Imported Commodities

Echostar’s top imported commodity at 95 million dollars worth in a 12 month picture was HS code: 852810, color television receivers. The second most imported product was HS code: 847330 parts and accessories for ADP machines and units. ADPs are automatic data processing machines and units. They include optical readers and machines used for transcribing data into data media. The parts and accessories for these ADPs are the second most valued import with an estimated value of  37 million dollars worth imported over a 12 month range. WIth PIERS Prospects we can see all the top commodities and respective estimated value.

Echostar’s Shipping History 

A more in-depth view of Echostar’s imports is available. We can view the entire shipping records for countries.  A full excel data sheet of Hong Kong’s shipping record to Echostar over 12 months is available for download at the bottom. If we look at the five most recent shipments from Hong Kong, we see that 3 out of five were the color television receivers commodity and 2 out of the last 5 were parts and accessories for automatic data processing machines. Download the detailed records of Echostar’s 124 imported shipments from Hong Kong.

Echostar’s Bill of Landing from Hong Kong

We can also view the individual bill of landings for an even more detailed look at the company and products. The most recent bill of landing from Hong Kong was selected, with the products of color television receivers. Note that any bill of landing is available with requests sent to this blog. With this bill of landing we have an transparent view of all the data available for a single shipment, vessel’s name, carrier, port of landing, foreign port, and weight. We can see the foreign company suppling the good, which in this case was Echostar trading partner Tiger Technology Inc. We can see phone numbers and addresses. Also included is a commodity and container information of what the description of the product is. Using PIERS we could do the same for Tiger Technology and many other companies.

Trade Data Report: MSA- Denver, Colorado. Home to Crocs, Echostar & Trinidad Benham

Denver MSA and Companies

Known as the Mile-High city, Denver, Colorado is located in the middle of the United States. Home to the Denver Broncos, Denver sits 5000 feet above sea level. This iconic city is next to the huge Rocky Mountains, and one can watch the sunset fall over these giant snow topped mountains.

Denver-Aurora-Broomfield, CO Metropolitan Statistical Area had a gross metropolitan product of 158 billion dollars in 2010. It is the 18th largest metro economy in the Nation. Because of its location, it is a key trade point for the country and a plethora of companies find their home in Denver MSA. Newmont Mining Corporation is the second largest gold producer in North America. Quizno’s, the sandwich company, Shane Company, the jeweler, and Cook Communications Ministries, the comic book/bible producer, are all headquartered in Denver.  CH2M Hill, a huge world-wide engineering company with over 30,000 employees is based in Denver’s MSA. Crocs, the footwear company and Trinidad/ Benham Corporation, a large aluminum foil and bean supplier are also located here.

  Denver’s Top Export Categories

According to Brookings, Denver exported 10 billion dollars annually, composing 7.3% of their GDP. The United States Department of Commerce accounts for about one third of these exports and groups them by industry and destination. According to the Department  of Commerce, Computer and Electronic Product Manufacturing (11% of total exports) was the most exported industry cluster in Denver.  The largest amount of these exports were bound for the Asia- Pacific Economic Cooperation followed by the North American Free Trade Agreement.

Denver’s Top Importing Companies

Not available to the general public, we can gain a picture of some of the largest importers in the Denver MSA using PIERS Prospects . Echostar Technologies, a huge technology company known for being the parent company of Dish Network, is the largest importer in this area, with imports valuing 140 million dollars in 12 months. Another notable company is the ninth one down the list, Trinidad/ Benham Corporation, the bean and aluminum foil supplier. According to Prospects, Trinidad Benham Corporation imports valued more than 18.6 million dollars in the last 12 months.

Trade Data Report: Export /Import Profile of the Global and U.S. Silicon Dioxide Industry

Silicon Dioxide

Silicon Dioxide is one the main exports of W. R. Grace and Company chemicals located in the Baltimore metropolitan area (see Grace Chemical report for company shipment details and individual bills of ladings). Silicon dioxide, also known as silica, has been known to man since before the Middle Ages. It can be found naturally in sand and quartz. Silicon dioxide when cooled quickly can be used in the production of glass and porcelain. Many telecommunication optical fibers are made from silicon dioxide. Silicon dioxide is a good electric insulator with high chemical stability. It can be used in electrical applications to store charge and block current. Silicon dioxide can also be used in a fiber form as a high-temperature thermal protection fabric. Excluding China, the United States is the largest producer, followed by Italy, and then Germany. United States produced 24,600 thousand metric tons in 2009, almost twice that of the second largest producer Italy. China’s data on silicon dioxide production was not publicly available.

World’s Top Silicon Dioxide Exporters

Silicon dioxide known by its Harmonized Code as HS 281122 falls under the foreign trade category of an Inorganic Acid HS 2811. The world’s top exporter of silicon dioxide is Germany, who dominates 32 percent of the world’s market, generating an export value of over half a billion dollars. The United States is the world’s second largest silicon dioxide exporter, generating 210 million dollars in 2009. The third largest exporter of silicon dioxide is China, who is competing with the United States. United States and China each represent roughly 13% of the world market in silicon dioxide sales.

United State’s Silicon Dioxide Exports

Using StatsPlus, a Piers product, we can look at the United States silicon dioxide exports to individual countries. Canada bought the most United States silicon dioxide, generating almost 55 million dollars in 2010. Mexico was the second largest buyer of U.S. silicon dioxide, purchasing 50 million dollars worth, a total of 17%. Japan was the third largest buyer and China was the fourth.

Mexico’s Import of Silicon Dioxide and Future Research

Mexico was the second largest buyer of silica dioxide. One interesting aspect of the Mexican market is the fact that Mexico imported 85% of all its silicon dioxide from the United States. It is safe to say that the United States has a strong monopoly on silicon dioxide sales in Mexico. It would be interesting to find what silicon dioxide is being used for in Mexico, what specific companies are involved in buying it, and what products they are producing with it. One could apply these trends to other markets to increase the United States’ market share, especially in newly industrialized countries who display a predicted increase in silicon dioxide use. Included is a chart of Mexican silicon dioxide imports by year and dollar value associated.

Trade Data Report: Baltimore Based W.R. Grace & Company Trade Profile & Shipments

Grace Chemicals Overview

W. R. Grace and Company is a large United States chemical company located in the Baltimore metropolitan area in Maryland. It has two divisions of chemical manufacturing: Davison Chemicals and Grace Construction Products. Davison Chemicals focuses on chemical catalyst, refining catalysts and silica based products which are mixed with refined crude oil to produce a plethora of items. Davison Chemicals make up roughly 64% of total sales. Grace Construction Products make cement and concrete additives, fire proofing chemicals, packaging sealants, finishing up the remaining 36% of sales. Grace Chemicals supports more than 6,400 employees and has annual sales of more than 2.5 billion dollars. Chemical export is one of the largest export markets in Baltimore, MD and Grace Chemicals is the third leading exporter by value of Baltimore. Piers offers a closer look at imports and exports of the company.

Grace Chemical’s Top Commodities

Piers reports that silicon dioxide is the top commodity shipped from Grace Chemicals and accounts for 37% of all shipments with an estimated value of 34 million dollars. Piers Prospects supplies the HS code for the products and number of shipments. A more valuable product, reaction initiators and accelerators, HS: 381590, makes up 6% of the total shipments, but produces an estimated value of 82 million dollars of exports.

Grace Company Export Destination and Value

With Piers, we see that Belgium is the top destination, receiving 23% of the total shipments with a value of almost 67 million dollars. United Kingdom receives 14% of the total shipments from Grace at an estimated value of 12 million dollars. Virgin Islands receives 5% of the export shipments while China receives 4%.  China has an estimated value of 5 million dollars while the Virgin Islands have an estimated value of 72 million dollars.  While China and Virgin Islands share almost the same percent of export shipments, the Virgin Islands estimated value is larger than even that of Belgium.

Detailed Shipping Information 

The difference between the Belgium exports which account for 23% of the total exports and 67 million dollars and the Virgin Islands exports which only account for 5% of the total exports and yet make up a larger value of 72 million dollars is worth further investigation. One can take a more in-depth look at exact export shipments to selected countries. The two charts below are the last five shipments to each country and included at the bottom are links to the full data sets in Excel format which include in detail every shipment made in the last year to the two countries. From a simple comparative view we can look at the latest 5 shipments. We see that while Belgium receives many silicon dioxide shipments, Virgin Islands receive more expensive reaction initiators and catalyst. This difference in product accounts for the difference in value.

One Bill of Landing from Grace Company Baltimore to Belgium 

Since the bill of landing is included with each shipment, of which we have hundreds to view, it would be beneficial to look at the most recent available shipment to Belgium, which took place 2 months prior to this article. The bill of landing details such information as the carrier, the specific vessel, the port, the vessel’s country of origin, the voyage, the date of departure, and the shipper. We can also see the exact count, weight, and commodity description.

Download 400 Belgium shipments by W.R. Grace.  Download 87 Virgin Island shipments by W.R. Grace. 

Trade Data Report: Export /Import Profile of the Global and U.S. Pepper Industry

Pepper 

Pepper, Harmonized code HS 0904, is a common household condiment. The description in the U.S. census bureau is “pepper of the genus Piper; dried or crushed or ground fruits of the genus Capsicum or of the genus Pimenta.” Pepper has been used since prehistoric times especially in India. Peppercorns, the unground pepper kernel, have been used as a precious trade item throughout history, so much so that they have been referred to as black gold and used as a monetary commodity. Black peppercorns have been found in ancient mummies and have been written about in Greek literature. Black pepper has been a major part of the spice trade and has influenced European explorers to find new trade routes to India leading to the discovery of the Americas. In 2002, pepper HS 0904, accounted for 20% of the monetary value of all the world’s spice trade. Black pepper today is produced mainly in Vietnam, accounting for 34% of the world’s pepper production. India accounts for 19%, Brazil 13%, and Indonesia at 9%.

Download and read the 42 page report prepared by the World Bank.

World’s Top Pepper Exporters 

In 2009 the world’s top exporter of pepper by value was Vietnam. Vietnam, the world’s largest producer of pepper, exported 630 million dollars worth of pepper in 2009, accounting for 17% of the world’s market. India, the second largest producer of pepper, exported 558 million dollars worth of pepper in 2009, taking 15% of the market. China who only accounted for 7% of the world’s pepper production, represented almost 15% of the world’s pepper export market.

World’s Top Importer of Pepper: The United States

Just as Rome was heavily reliant upon pepper in their time, so is the United States today. The U.S. imported 671 million dollars of pepper in 2009, and so was the number one importer of pepper in the world. the U.S. imported more pepper than any one country exported. It bought a total of 18% of the world’s pepper in 2009. The next largest buyer of pepper was Germany, who bought less than half that of the United States. Of this 671 million dollars spent on pepper, the U.S. bought 23% from one country, Indonesia, equalling 106 million American dollars spent on Indonesian pepper. India was the U.S.’s number two source for pepper and Vietnam was the third. The graph below shows the trend of pepper bought from countries by value over the last five years. Pepper imports to the United States from Indonesia were below 30 million in 2006. In 2010 the United States bought more than 100 million dollars worth of pepper from Indonesia. Indonesian sales of pepper to the United States more than tripled in the past five years, upsetting India and all other place holders. Indonesia is represented in yellow in the graph below.

Trade Data Report: Baltimore Based McCormick Company Trade Profile & Shipments

McCormick and Company

McCormick is one of the most known spice brands in the United States. This leader in the spice world is located in the Baltimore Metropolitan statistical area (see Baltimore’s WTD article).The famous red spice bottles are as ubiquitous as Campbell’s Chicken soup. McCormick started his business in 1889 from a basement at the age of 25. He sold spices door to door. Currently the company now employs 7500 people.  Being a spice leader, McCormick and Company imports many of their products. 84% of McCormick’s shipments over the previous year were imports, while the remaining 16% were exports. There were 422 shipments received by McCormick and Company with an estimated value of just over 12 million dollars.

McCormick and Company’s Top Imported Commodities

Four imported products, listed by harmonized code, have a value over 1 million dollars each. The most valued product, pasta HS:  1902, had an estimated value of over 4 million dollars. Some of McCormick’s best-selling products are premixed dried pastas with spices already added. The second product was pepper, HS: 090412, with a worth of 2.5 million dollars. Black pepper was no doubt the number one spice used and sold by McCormick. The third import was juice of any single fruit or vegetable unfermented, HS 200980, worth around 1 million dollars. This is used to add flavor for mixed spices. The final product that is above one million dollars of estimated import value is container bags, HS 420292, used to package the spices and premixed pastas that McCormick sells.

Top Countries Selling to McCormick and Company

McCormick and Company imports a majority of its products from three countries: Thailand, China, and Indonesia. 57% of McCormick and Company’s imports comes from Thailand with 241 shipments: a total of 4 million dollars. McCormick and Company bought 3.3 million dollars worth of goods from China in 126 shipments. McCormick and Company also bought 3.3 million dollars worth of goods from Indonesia in 25 shipments.

Shipments Coming From China and Indonesia 

With Prospects, a Piers data program, we can look into the specific shipments coming from each of these countries. When we look at China’s latest shipments we see that the majority of the latest are pasta, HS 1902. When we view Indonesia’s shipment record we see that a vast majority of shipments contain pepper, HS 090412. Included at the bottom is a comprehensive excel sheet of all the available shipment data from China and Indonesia to McCormick and Company.

Download shipment detail (MS Excel compatible Spreadsheet) for all 126 China Pasta shipments.

Download shipment detail (MS Excel compatible Spreadsheet) for all 25 Indonesia Pepper shipments.

Trade Data Report: MSA: Baltimore, Maryland. Electricity, Chemicals, Spices & More

Baltimore and Its Companies

The Baltimore metropolitan area is located in Maryland, the largest seaport in the Mid-Atlantic United States and home to almost 3 million people. The name comes from an Irish gaelic phrase meaning, “Town of the Big House.”

Constellation Energy, the nation’s largest seller of electricity, finds its home in Baltimore. Grace Chemicals is also based out of the Baltimore area and makes chemical catalyst, refining catalyst, silica-based products. Its performance chemical department focuses on cement concrete additives, sealants, and fire proofing chemicals. McCormick and Company is a major manufacture of spices, herbs, and flavorings. These herbs and flavorings are available at most major food retailers in the United States and have become as common place as Campbell’s Soup. Sylvan Learning Center, Under Armour and Fila USA is also based out of Baltimore.

Baltimore’s Exports

Baltimore metropolitan area exported 9 billion dollars of material in 2008. This ranked it 31 MSA in the Nation. The export share of its gross manufactured product was almost 7%.

This once industrial hub is now more service oriented but its exports still support around 74,000 jobs. If each person making a living off of Baltimore’s export industry supported 2 dependents, the export market of Baltimore would support 222,000 Americans. The International Trade Administration United States Department of Commerce has reports on almost a third of these exports citing transportation equipment to be the largest export at 22% and Chemical Manufacturing to be the second largest export at 16%.

Grace Chemical’s Exports 

Using PIERS Prospects we can look at the largest exporting companies present in Baltimore. From this chart we can see the name of the individual companies, the addresses and the estimated value of exported material. Since one of the largest over all export sectors in Baltimore is chemicals and that one of the largest companies present is Grace Chemicals, the third largest in export value, it draws special attention. PIERS Prospects has accountable data for over 250 million dollars worth of Grace Chemical exports. It is reasonable to suggest using PIERS to gain a deeper look into this company.

Also note that most of the top 6 listed “exporters” are actually expeditors: companies who do not actually export products but simply provide transportation and coordination services. This is one of the needed qualifications that must to be attached to any intelligent analysis and application of the U.S. Waterborne shipping data.

Trade Data Report: Export /Import Profile of the Global and U.S. Soybean Industry

World Soybean Production 

Soybeans, harmonized system code (HS: 1201) and Standard Industrial Classification (S.I.C.) 0116, include all soybeans whole or broken. The United States is the world’s leading soybean producer, growing 38% of all the world’s soybeans. Brazil is the world’s second largest producer of soybeans at 27%. China produces 7% of the world’s soybeans.

World’s Top Soybean Importers

China is by far the world’s top soybean importer, buying over 33 billion dollars worth of soybeans in 2009. They constitute 54% of the world’s total import market. It is useful to note that China is dependent on soybeans and does not produce a large quantity. The second largest importer, Japan, imports 30 billion dollars less than China and had about 3 billion dollars of imported soybeans in 2009.

World’s Top Soybean Exporters

The United States is not only the world’s top soybean producer but also the top exporter dominating 49% of the market. The United States’ export market of soybeans produced more than 30 billion dollars in 2009. The world’s second largest exporter of soybeans is the second in production, Brazil. Brazil’s soybean exports made up 42% of the market value in 2009. The United States and Brazil together constitute more than 91% of the world’s exported soybeans.

United States Soybean Exports to China 

United States, the world’s top exporter of soybeans, sells most of its soybeans to the world’s largest buyer, China. China bought 59% of all United States exported soybeans in 2010. The second largest buyer of United States soybeans was Mexico who bought 8% and Japan who bought 6%. China, contrary to many predictions, continues to import more and more foreign soybeans. In 2006 the United States sold China approximately  2.5 billion dollars of soybeans. 2010 found China buying almost 11 billion dollars of United States soybeans.

Further Research and Application

As soybeans have increased in value and amount imported, it is important to note what has occurred in the Chinese soybean market over the last 5 years. Newsworthy trends and cultural signs that resulted in such growth in China’s demand for soybeans can be applied to similar markets. Linking cultural signs and trends to new locations labels and targets the most promising markets. This linking is a one of the most sound investment strategies. Imagine if one had predicted the Chinese soybean market increase from 2006 to present day. It would have produced a major investment opportunity.

Trade Data Report: Export /Import Profile of the Global and U.S. Tobacco Industry

Unmanufactured Tobacco

Tobacco, coded by Standard Industrial Classification as S.I.C. 0132 and the Harmonized system of Commodity Classification as HS: 2401, includes all unmanufactured tobacco. This simply means tobacco before Marlboro wraps it up and sticks a filter at the tip. This is the pure tobacco, usually already cured, but not rolled and boxed. It includes subcategories of all major types of tobacco, leaf, and curing processes. Tobacco is also listed on how it is to be used, such as: wrapper tobacco, cigarette leaf, cigar leaf, cigar binder, and by what type it is. A few examples of the types included in HS: 2401 are flue-cured stripped Tennessee tobacco, dark-fired Kentucky, and Virginia stemmed sun-cured.

World Tobacco Production 

Four countries, China, Brazil, India, and the U.S., produce two-thirds, 67%, of the world’s tobacco. China is the global leader, producing 40% of the world’s total tobacco. Brazil trails as the second largest producer, with less than half of China. United States produces roughly 6 % of the world’s tobacco.

World’s Top Tobacco Exporters 

The world’s top tobacco exporter is Brazil, owning 27% of the world’s market by value. It is interesting to notice that while the United States is fourth in production, we do hold a substantial export market. The United States is the second leading exporter with 10.5% of the world’s market. Unmanufactured United States tobacco was estimated at an over 2 billion dollar export revenue generator.

United States Tobacco Imports

The United States is also the world’s second leading importer of tobacco. Our suppliers are varied except for one. Brazil is the leading provider of tobacco to the United States. This one country, Brazil, holds claim to 39% of our total tobacco import. Turkey, famous for their blends, is our second greatest tobacco source, fulfilling 12% of our import market share. If we take a more macro view of imports of tobacco by region, we see that the Americas make up 47% of U.S. tobacco imports, North America Free Trade Association makes up 13%, the Middle East sits at 12%, Asia’s at 11%, and Europe is 9%.

Brazil’s Tobacco Export Trends

Brazil is by far the leading world exporter of tobacco and an equally dominating source for United States tobacco, thus, it is important to notice its export value and export trends. Tobacco production and export have recently exploded in Brazil. From 2004 to 2009 Brazil’s tobacco exports have grown from around 1 billion to almost 6 billion. It is not surprising that Brazil is a prime location for tobacco growth, being home to the famous Amazon Rainforest. Below is a detailed graph displaying Brazil’s past five-year tobacco export trends.