Tag Archives: Trade Intelligence

World Trade Daily Commercial Services: Consultation, Application Development & Project Management

Consultation, Application Development & Project Management

I am available on an hourly, daily or project basis, to consult and lead during the many facets of developing, integrating and applying trade intelligence.

By the day : Contact me directly via email.  Rate: $1,000 to $2,000 per day ($125 to $250 per hour), plus expenses (billed in 1/2 day increments).

By the project (over 10 billable days):  Dependent upon the nature and scope of the project, a discount in my daily rate may apply.  I also have several handfuls of excellent technologists, writers/editors and graphic design folks at my disposal if needed for the project. Rates vary from $35 to $125 per hour for their time & expertise.  There are few things I enjoy more than directing a team of competent professionals as we work together on an innovative project toward an inspired objective.

Examples of Customized Trade Applications

Besides developing innovative trade intelligence applications that were ultimately acquired by the largest T.I. Provider on the planet, we worked with a couple of dozen organizations along the way developing custom trade applications that were designed and integrated for their specific requirements and target markets.  Included among them are the following:

Our first interface, named “Trade Made Easy”, later renamed CenTradeX 2.0., was a colorful interactive feast of statistical interplay (over 1 billion dynamically generated charts and graphs) wherein users would select a “X” axis (one of 25,000 products) and a “Y” axis (one of 200 listed countries) and thereupon an entire website would be magically created from which they could retrieve a plethora of information.  This application fared very well within academic circles.

G.E.M.S. Developed for the U.S.D.A. Foreign Agricultural Service for their 50 state marketing offices (customized for each of their four regions) to help U.S. Food exporters to find and market overseas.  GEMS integrated Statistical, Company, Tariff, Shipping costs and foreign exchange rates into one easy to use system.

S.E.E.D.S.  State Export & Economic Development System.  Developed, then customized for many state trade offices including California, Pennsylvania, Alabama, Oklahoma, Tennessee, Virginia and more.  The user interface was designed to work seamlessly within the look and feel of the respective states’ websites therefore “attributing” tremendous technological and information power to the state and providing valuable services to their consistency.

SEEDS was further customized for the WTCA (World Trade Centers Association) for their 300 WTC’s in 100 countries servicing 1 million members.  Each member trade center’s U.I. (user interface) was regionalized to present data pertinent to their city, state, country, industries and companies.  In addition, automatically generated reporting – incorporated into each members interface – helped generate revenue from the sales of reports and services.

Our development work went beyond simply modifying our interface to the “style sheets” of our respective customers.  We specialized in doing “innovative things with international trade data” to meet the specific requirements and needs of each client.  For MSU/Global Edge (the most visited international info. website on the planet at the time) we constructed interactive industry, country and state “channels”.

For the State of Pennsylvania (with the most “funded” state international trade office at the time) we developed an advanced interactive platform for their exporting companies throughout the state that lead them – step-by-step – through a diagnostic tool that evaluated their export readiness, directed them to the appropriate resources and gave them a 20 plus customized comprehensive global market report on their selected product.

In collaboration with E.C.R.M and Walmart we developed and integrated several “industry channels” within their Marketgate application suite, which provided trade and market intelligence to U.S. retail sourcing professionals and suppliers.  Incorporated within the system was the capability to generate ad-hoc “on the fly” reports based upon the users selected product – source country pair.

Working with Panalpina (a long time CenTradeX customer) and other logistics providers we developed a geographically oriented prospecting tool which was later named Prospects. Under the hood of this powerful application was our superior capacity to geo-code the transactional data we received from U.S. Customs – connected with huge data repository of International companies.

There were handfuls of other clients, big and small that we worked with to develop business solutions for their international trade service.  Much innovation has been done within the world of trade innovation, but there is still very very much to do.  It is a trillion-dollar industry that still operates in many ways like we still exist in the industrial age.  I’d love to help you develop and refine the technological tools you possess to better compete and succeed in the global market place.

World Trade Daily Commercial Services: Research & Reporting, Publishing & Social Marketing and Sponsorship

Research & Reporting Services

Over the last decade, we have performed a plethora of research and reporting services for clients in many industries.  The scope and focus have ranged from industry and sourcing analyses conducted for Disney, Wal-Mart, ECRM and the WTCA… involving months of work and a handful of researchers, writers and analysts… to straightforward product, prospect or competitive reports usually produced within a couple of days… to simple downloads of a competitor’s shipments and suppliers or a statistical view of prospective export markets ready within hours.

Prices for the above have ranged from several hundred dollars to $25,000 in the case of the comprehensive analysis of the China “tainted toy” fiasco in which we utilized our data sources to analyze over 400,000 toy shipments by hundreds of China suppliers to thousands of U.S. importers.  This study was utilized by Wal-Mart, the New York Times and the U.S. Toy Association. See our article The Use and Application of Trade Intelligence Can Be a Matter of Life and Death.

We maintain the capacity, with the Prospects and Stats Plus licenses to produce smaller reports very quickly.  Please contact me at robert@worldtradedaily.com for further information.

Custom publication and marketing.  We can take the pain out of publishing for you.  Contract with us to provide all your blog design, content development, technical administration and social marketing. We can produce content designed specifically for your company and target market(s).

To design, integrate, write, edit, market and administrate the complete content, blog technologies and social networking aspects for your trade or international business related company would require you hiring and overseeing a handful of employees which is very costly. We provide a less expensive, more professional alternative.  See the cost structure below.

There is an initial one-time fee of $10,000 to cover consultation, design and complete set-up. Outsourcing is a great way to improve content without hassle or hiring several employees.

  • Articles written, published and marketed once per week (50+ articles, averaging 400 words each with visuals): $36,000 annually.
  • Twice per week (100+ articles): $60,000 annually.
  • Weekdays (five times per week): $100,000 annually.
  • Daily (seven days a week): $120,000 annually.

Sponsorship & Republishing

Sponsorship of WorldTradeDaily.com.: Your banner advertisement will appear as the header (570 X 80) on a WTD article once each week of the year: 52 placements, 52 articles.  Your header will remain permanently attached to each of the 52 respective articles for $5,000 per year which is less than $100 per article.  You can become a “global” sponsor of all 365+ articles per year along with site header attribution for $25,000 annually.

Sponsorship with (re)publishing and marketing rights:  You may integrate our articles within your website and thus promote enhanced pertinent fresh content  every week – 52 articles annually – for less than an additional $20 per article – only $1,000 per year.  Two per week (104 per year) @ $2,000 and so on.  A good way to add new weekly content to your website.

CenTradeX: Development and Overview of Available Trade Intelligence (T.I.) Applications

The following provides a cursory outline of processes employed by CenTradeX in crafting innovative trade intelligence applications. Readers are invited to (mouse over for explanation) click on the hyperlinks below to expand their understanding further through graphic illustration and related articles.  Additional information can be made available upon request.

From March 13th WTD article, “The Holy Grail of Trade Intelligence: “Connecting the Dots” to U.S. Customs Data”: CenTradeX, founded by Robert Thompson in 2000, initially focused on bringing value added features to U.S. import and export data.  Thereafter, they layered and connected this U.S. centric data with global import and export data on 200 countries. Up until then, no one had ever layered and integrated these data sets.

Atop these various statistical data collections, CenTradeX crafted a graphic, interactive interface.  After selecting an “X” vector (one of 20,000+ HS coded products) and a “Y” vector (one of 200 listed countries) users were presented with dozens of dynamically created reports on their chosen “intersection”.  Over a billion unique reports could be potentially generated by the system. Next, they identified and incorporated company data – both foreign and domestic – to uncover the actual traders behind the statistics. CenTradeX assimilated the best-known sources; Kompass, Harris Info, Hoovers, D&B, PIERS, etc.

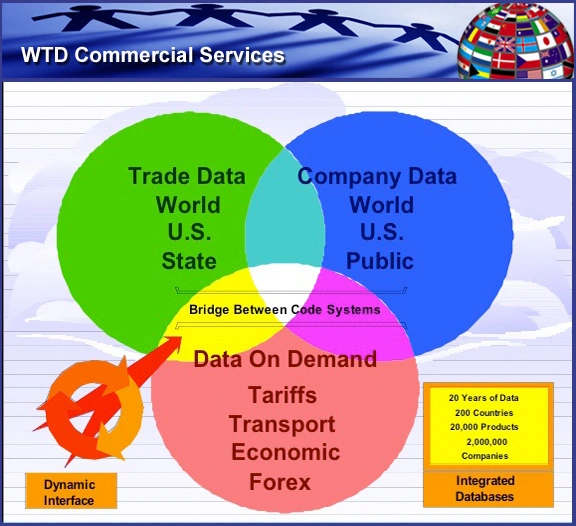
One of the challenging aspects was that statistical data is organized under one (HTS) classification schema while company information is organized under other (unrelated) systems (SIC, NAICS, or a vender’s particular proprietary taxonomy).  Further, they successfully incorporated other disparate data sets such as tariffs (for all countries and products), estimated shipping costs (from various U.S. port regions to any /all countries), live stock market and Forex feeds as well as their clients’ proprietary data collections.

The most daunting data transformation endeavor was that of understanding, normalizing and intelligently incorporating U.S. Customs data into this dynamic mix. It took CenTradeX several years to develop an intelligent system by which to quickly and seamlessly assimilate the daily Customs feeds.

From March 12th WTD Article, “Why U.S. Customs Data is The “KING” Among All International Trade Data Sources.” U.S. Customs (waterborne manifest BOL) data is considered the most valuable data collection. Why? It’s available on a daily basis, within hours after shipments clear. It’s detailed and transactional; containing shipment by shipment accounts of suppliers, importers, products and supply chain.  It represents $1 trillion+ global trade a year.

See this MUST READ article: March 1 WTD Article – “U.S. Customs Data Primer Part 4: Enlightenment Through Graphics & Diagrams”.  Also check out March 14 WTD Article, “U.S. Customs Data: Parsing & Normalization. The First Steps in its Long, Transformational Journey” and March 15 WTD Article, “U.S. Customs Data: Resolving the Enigmatic & Challenging Problems Inherent Within the Data” and March 16 WTD Article, “Complete Transformation: Final Refinements & Enhancements Applied to U.S. Customs Data” for a deeper, more technical explanation of the processes involved in parsing and assimilating U.S. Customs data.

Transformed Customs data, integrated with other statistical, company, trade and economic data sets can be a powerful tool by which to successfully navigate within the multi-trillion dollar international trade marketplace.  A plethora of Trade Intelligence applications and services can be thus developed and marketed.  See Samples of selected developed applications and WTD Article, “PIERS, Part 3: Acquired Apps – Stats Plus, Prospects & Trade Finance.”

The collection of programs, procedures and referential databases with which CenTradeX transformed raw data into usable business intelligence is referred to as their “A.I.” (Artificial Intelligence Engine).  It, along with their huge data repositories of statistical, company and transactional data collected over the years, represent the primary assets (along with the human intelligence and experience by which to integrate, develop and deploy them) that are offered for license, sale or joint venture consideration.  Commercial Services offered through WorldTradeDaily.com.

Complete Transformation: Final Refinements & Enhancements Applied to U.S. Customs Data

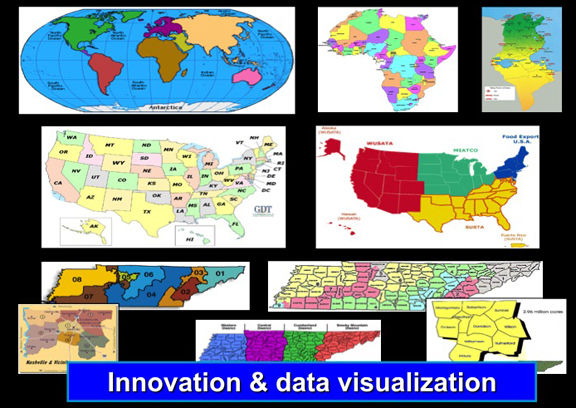
Next along its path of transformation and enlightenment, Customs data is enhanced with a number of ancillary but related (and connectable) data.  Once the company location and name has been successfully resolved, its location can be assigned to a respective county, city, MSA, CSA, CBSA, congressional district, area code, time zone or even latitude-longitude.  Thereafter it can be integrated into a dynamic mapping application or be used in detailed geo related analysis and reporting.  Any number of “groupings” or consolidating factors can thus be applied.

GEO MAPPING of customs data after resolution of company name iterations, disparate locations and other aberrations.

Expanded information about the vessels (ships), containers (types, sizes), container owners, ports, carriers (SCAC reference) and any number of “connectable” relevant databases can also be linked during this step of the process. The possibilities are as infinite as imagination and business requirements dictate.

Referential database utilized to enhance normalized AMS Customs data. Click to enlarge and open in a new window.

At this point, the U.S. Customs data has been imported, organized, cleaned, groomed and dressed.  It is now ready for “prime time”.  It’s show time in the data world.  The data is now ready to move into an “exportable” mode.  Therefore, it is organized (and refreshed) within a distinct database of its own.

All the processes, detailed over the last several days, tens of thousands of individual BOLs, have been completed in a number of hours.  These routines run habitually every day.  All databases and processes – through the creation /update of the “AMS Trade Data Export” DB – occur internally and securely (behind the veil).

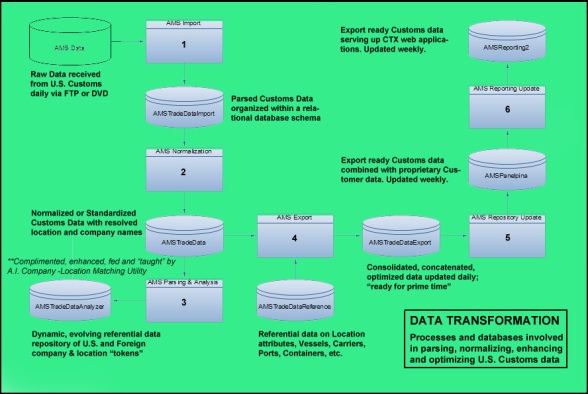
Now four processes, involving six databases have been completed.  Thereafter, two additional processes are initiated on a weekly basis. One integrates various client’s proprietary data with our completed Customs Data and updates the databases upon which their respective web applications sit.  The second process refreshes the reporting repository from which the host of commercially available web applications draw.

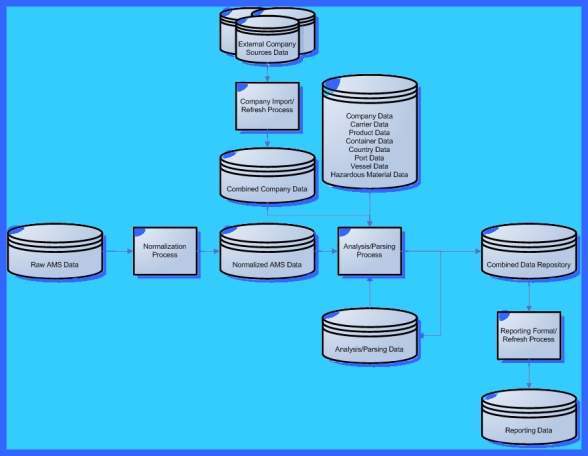
The Journey of Customs Data Transformation from Raw data to Trade Intelligence. Click to enlarge.

Transformed Customs data, integrated with other statistical, company trade and economic data sources can be a powerful tool to navigate and succeed within the multi-trillion dollar international trade marketplace.  A plethora of applications and services can be enhanced by the skilled utilization of Trade Intelligence.

Customs data tracks over $1 Trillion of U.S. Imports annually.

The collection of programs, procedures and referential databases with which we transform raw data into usable business intelligence we refer to as our “A.I.” (Artificial Intelligence Engine). It, along with our huge data repositories of statistical, company and transactional data collected over the years, together represent the primary assets (along with the human intelligence and experience by which to integrate, develop and deploy them) that we are offering for license, sale or joint venture consideration.

A.I. Artificial Intelligence Engine transforms data into intelligence to support international trade services and applications.

Please refer to our Commercial Services Menu on the top navigational bar of this site for information on Application Licensing, Research & Writing ServicesDatabase Repositories, Artificial Intelligence Engine as well as other Consulting, Project Management and Application Development Services.

U.S. Customs Data: Resolving the Enigmatic & Challenging Problems Inherent Within the Data.

Two of the most important normalization processes are accounting for the many iterations of company names and establishing an accurate company location.  See the previously published article, “The ABCs of U.S. Customs Data- Issues & Shortcomings“.  There can be many dozen iterations of the same company name.  This wreaks havoc with the veracity of the data under analysis.  The problem is evident is a cursory review of trade intelligence applications offered by most data vendors.

Text Strings converted into Data tokens for analysis and processing

In order to resolve these issues, the name and address fields contained on the bills of lading (for both shipper and receiver) are broken down into “tokens” and compared with a dynamically evolving referential database of “resolved” names and addresses.  Actually, accurately “geo-locating” the entity is the simplest of the two tasks. Zip codes, for the U.S. at least, follow a predictable pattern and typically occur at the end of the text string in the  “address” block of the flat file.

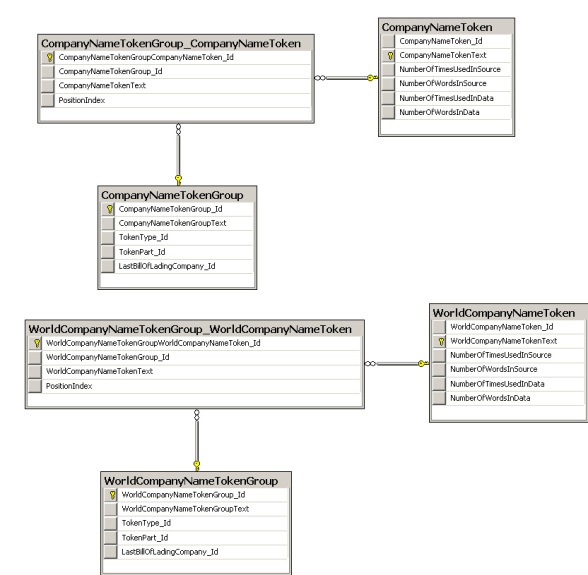
The two diagrams below are tables utilized within the fourth database involved in the third step of the transformation.  The first diagram shows elements that are utilized to resolve company location.  The second shows those necessary to resolve company name.

A separate, complimentary and very important utility – called the company-location resolver – is THE essential cornerstone of the A.I. (Artificial Intelligence) Engine and is required to dynamically evolve and “educate” the system.  More on that later.

Database used to "normalize" a location for an entity. This is the basis of the innovative geo-location feature utilized in the Prospects Trade Intelligence platform.

Normalization of the shipper or importer is essential to veracity in analysis and reporting. It's a challenging task to say the least. Most Purveyors of Trade Intelligence products using Customs Data don't even bother.

The location – company match utility is a very nifty accessory and vital component of the A.I. Engine.  Although the system is set up to quickly, accurately and automatically normalize U.S. Customs data, it also has the capacity to “learn” and improve its performance over time. Some of this learning takes place automatically over time as it gains more and more experience performing its daily processing rituals.  Adjunct education is interjected manually.

For instance, perhaps during the last several days/weeks/months processing routines, our A.I. Engine encountered some company name iterations that it hadn’t handled before and wasn’t in its library of established “tokens”.  Conveniently, it would display these unresolved iterations, ranked by the number of occurrences along with likely matches.  With one stroke an operator could resolve and match all particular aberrations or variations on a particular supplier or importer name or location… sometimes representing several hundred or thousand individual BOLs.

Thus the A.I. Engine learned something new.  And unlike its human counterparts, it will never have to ask the same question again.

Despite the sophisticated array of advanced technology deployed to automate the process of transformation, sometimes semi-automated manual intervention is called for.

The location – company match utility also can be used to link unlinked branch locations to their respective parent company or regional/ divisional headquarters.  Furthermore, it can process and link a proprietary client’s database of customers as well.  In this fashion, one can monitor customer’s trading activity and supply chain operations on a daily basis! This information can be incorporated into a web application which is distributed within the secure company intranet or protected proprietary web site.  An example is Panalpina, one of our  previous (CenTradeX) clients wherein we integrated their proprietary information into a customized web application for distribution to their regional sales offices.

U.S. Customs Data: Parsing & Normalization. The First Steps in its Long, Transformational Journey.

It took us several years (at CenTradeX) to develop an intelligent system by which to quickly and seamlessly assimilate the daily Customs feeds.

Over time we developed and incorporated automated procedures and administrated them under an umbrella control panel. Statistical data update processes from U.S. Census and U.N. Comtrade were initiated from this centralized control panel.  U.S. Customs data, initial processing and normalization as well as company, parent and location matching, were also conducted from the same control panel.

A detailed diagram of the individual components that make up the control panel (as a constituent part of the A.I.Engine) can be downloaded from Google Docs by clicking this link.

Component of the A.I. Engine. Control panel by which to initiate data import

Company data collections (from sundry vendors because each contained its own unique non-standardized characteristics) were initially processed utilizing different arrays of queries and procedures.  They were then integrated into the combined company repository which, in turn, were correlated with the U.S. Customs and statistical data.  See U.S. Customs Data Primer Part 4: Enlightenment Through Graphics & Diagrams for illustrative diagrams.

Data sources. Processing schedule

U.S. Customs Data that we referred to as AMS – automated manifest system – went through six distinct processes which are depicted below.  An illustrative diagram of all six processes and eight sequential databases (or collections) can be viewed by clicking this link.

Customs data is received and processed on a daily basis, but the final, resultant databases utilized to serve up web reports were refreshed weekly to allow for enhancements (beauty treatments) and interconnectivity with other data collections.

AMS (Customs) Data requires many steps of parsing, normalizing, refining, integrating and optimizing before it is ready for “prime time”.

Let’s look at the steps from the beginning.  Roughly speaking, the first task is to import all the data properly – correctly parsing all the elements contained in the original “flat file” and organizing them within a relational database.  Every data element and every permutation and aberration must be accounted for.  The diagram below depicts the second of seven databases (the first “DB” is really just a collection of the all the raw AMS or Customs data itself). This database is resultant and refreshed daily from the first processing step.

Parsed Customs data sorted and organized within a relational database structure. Click to open image in a new window.

A high(er) resolution depiction of the above diagram can be obtained from our Google Docs site, by clicking this link.

Next comes the “normalization” process, wherein each element of parsed data is refined and standardized. For instance, a simple Port code, whether foreign or domestic,  has its corresponding state, province /region, country and normalized name.  Each container code is translated into presentable information about its type such as refrigerated or non, height, length and particular identifying number. Within this normalization process company name, address, and contact iterations are resolved as well.

Below is a diagram depicting the third of eight databases after the second step along the Customs data transformation journey.  A high(er) resolution image is available for download from our Google Docs site.

The second step in the Customs data transformation process. Click to open in a new window.

The Holy Grail of Trade Intelligence: “Connecting the Dots” to U.S. Customs Data

The original CenTradeX Trade Intelligence platform was developed over a three to four-year time frame from Spring 2000 to Spring 2004.  Initially, we focused on bringing a host of value added features to statistical U.S. import and export data from U.S. Census.  Thereafter, we layered and connected this U.S. centric data with global import and export data (from U.N. Comtrade) on approximately 190 countries.  In time, we also incorporated U.S. state export data into the mix.  Surprisingly, no one had ever layered these data sets together before.

HTS (Harmonized Tariff System) Classification schema. The essential “language” of international trade statistics.

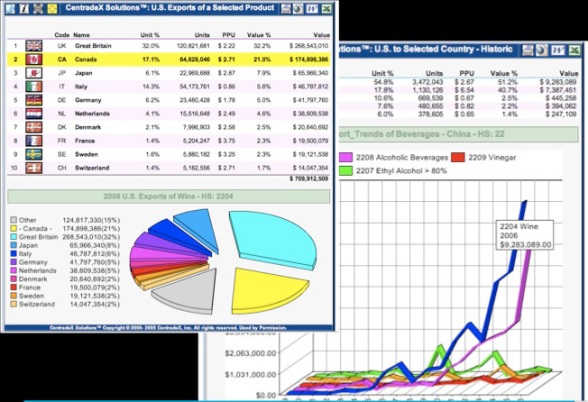
Atop these statistical data collections, we crafted a graphic, interactive interface wherein users after selecting an “X” product vector (one of the 6,000 Harmonized System product classifications) and a “Y” location vector (one of 200 countries listed) were (almost) instantaneously presented with dozens of dynamically created reports representing many perspectives pertaining to the intersection of their choice.  Over a billion unique reports could be potentially generated by the system. These included historic analyses spanning 20 years, trends 1, 3, 5 years into the future, contextual reports for the respective region and industry, competitive analyses, product/industry segmentation and trending, etc.  One economics /international trade professor remarked that the system made “data dance”.

Over a billion dynamically generated reports could be produced by the CenTradeX system

Market testing and resulting feedback, compelled us into the task of finding and incorporating company data – both foreign and domestic – toward the objective of uncovering the actual traders behind the statistics.  Economics and trending with numbers is one thing… pinpointing buyers and sellers is quite another.  Consequently, we apprehended and assimilated the best known company sources (at the time) including; Kompass, Harris Info, Hoovers, D&B, PIERS and others.

One of the most challenging aspects was that statistical data is organized under one (HTS) classification schema while company information is organized under other (unrelated) systems (SIC, NAICS, or a vender’s particular proprietary taxonomy). However, after successfully tackling that enigmatic brainteaser, we were able to incorporate other data sets, tariffs (for all countries and products), estimated shipping costs (from four U.S. port regions to any /all countries), foreign exchange as well as our clients’ proprietary data collections and others… with relative ease.

Connecting disparate data collections is challenging

By far the most arduous of our data transformation and enhancement endeavors was to understand, normalize and intelligently incorporate U.S. Customs data into this dynamic mix.  ALL OTHER purveyors of Customs data started the other way around.  Some (the best) have consequently connected some other data elements.  Most notable among the few is PIERS, who several years back contracted with D&B to “tag” their data collection of U.S. Importers & Exporters.  Datamyne is presumably undertaking a similar process now.  Panjiva has connected with reasonable success many other vendor’s data pertaining to foreign sourcing. To my knowledge, at the present, no others have made those necessary connections.  Zepol has begun offering statistical data, but not connected to Customs data. They remain in separate unrelated silos.  Suffice it to say, there are still significant vistas to explore and develop.

The 45 second video (slide show) below is an irreverent depiction of  what many users have reported experiencing when trying to find solid “trade intelligence” amidst the seemingly endless sea of  Customs data obscurity.

Why U.S. Customs Data is The “KING” Among All International Trade Data Sources

In the past we published a series of 5 articles; “U.S. Customs Data Primer”, Parts 1-5, about the particulars of understanding, processing and enhancing the daily transactional inbound shipping records published by DHS/Customs.  This article will expand upon the fourth article in that series, “U.S. Customs Data Primer Part 4: Enlightenment Through Graphics & Diagrams” which provides a visual guide for the processes we at CenTradeX employed in transforming raw data into trade intelligence.

The 90 second video (slide show) below portrays the original Trade Intelligence vision and mission that fueled the innovative growth and development of CenTradeX.

Developing innovative and powerful trade intelligence applications involves attending to three major areas: Access, Integration and Delivery.

  • Access: Helping the target audience(s) understand, find and use the data and application.
  • Integration: Normalizing of base data and connecting it with other relevant data sources.
  • Delivery: Enhancing the speed, efficacy and beauty with which the combined data is organized and presented.

For the purposes of this series, we will only focus on the second aspect, Integration.  Furthermore, having provided a foundation of understanding through the above referenced (linked) article, we will proceed to explore the more technical (under the hood) facets involved.

I refer to U.S. Customs waterborne import manifest data as the “base” data because it is considered (by myself and many others) the most intrinsically valuable, if challenging, international trade data set available.  It’s daily. It’s transactional. The U.S. is considered the easiest market to access. It contains a wealth of detailed information about the global supply chain. It represents $1 trillion dollars of trade a year.

U.S. Customs data is #1.  It’s THE KING of the international trade jungle.  However, a powerful Kingdom is more than just one regal personage.  It must include a capable entourage as well. Thus the need for complimentary data sets.

The first, primary step in building a powerful trade intelligence “kingdom” is attending to the King. PIERS has an easy to understand graphic portraying  the processes of normalizing “base” Customs data layer.

PIERS graphic portraying the processes involved in Normalizing Customs data

In performing the seven steps highlighted above, we at CenTradeX developed and refined many sophisticated procedures.  Over time, and through much scrutiny and evolution, we constructed a reliable, interconnected system of transforming data into intelligence.

  • It involved an array of automated queries and stored procedures for importing new data on a regular basis.
  • It involved created programs and “scripts” that would parse, tokenize and reference selected data elements, compare and contrast them with its expanding library and referential databases as well as “learn” better ways of matching and connecting.
  • It involved scouring the planet for the best, most reliable, accurate and timely ancillary databases to enhance and expand the KING and the Kingdom.

U.S. Customs Data Primer Part 5: Reference Guide Other Related WTD Articles

This week we went under the hood to look at nature and application of Customs data that tracks U.S. Waterborne Import Shipments from Overseas Suppliers and Sellers.

There are a number of previous articles wherein I have referred to other shortcomings and challenges inherent with the understanding and applying U.S. Customs data.  Please note the following:

We also published several dozen articles focusing on the current Trade Intelligence purveyors of Customs data.  The links provided below will pull up a handful of articles each – for a particular company, group of companies (in cases where they are “minor, second tier” providers) and summary evaluations. You can also find these articles, and others grouped by various categories, on the top navigation menu of this site.

Please refer to our Commercial Services Menu on the top navigational bar of this site for information on Application Licensing, Research & Writing ServicesDatabase Repositories, Artificial Intelligence Engine as well as other Consulting, Project Management and Application Development Services.

U.S. Customs Data Primer Part 4: Enlightenment Through Graphics & Diagrams

So now that we have addressed a few of the issues relating to understanding the inherent limitations contained within the U.S. Customs data, let’s look at the processes we (at CenTradeX) employed in parsing, normalizing and enhancing this data.  Every Trade Intelligence provider has their own approach to processing the data, along with their own particular brand of “spice” they add as well as the tools utilized to search through and display the data. Notwithstanding, the best few have many things in common.

Therefore I believe the following explanation may be both enlightening and educational, whether or not it is precisely mimicked.  First of all, let’s take a look at the “big picture”.  As reflected in the illustration below, Customs data contains detailed records – bills of lading – of the particulars of each and every transaction between foreign shipper and U.S. receiver for waterborne freight.

The Big Picture of Customs Data and the trade related information packed therein. 

As I’ve mentioned, Customs data is distributed (as a “flat file”) on a daily basis as the BOLs for various arriving “vessels” are cleared at the  respective U.S. ports.  The first, rather arduous process, is to “normalize” data into usable, organized elements contained in a relational database.

Normalization process for daily AMS Customs Flat files

We found that the best, most efficient method to add accuracy and value to Customs data, after the initial normalization process had been completed, was to connect it with our other comprehensive company and referential databases.  After going through many elaborate transitions, this enhanced customs data was ready for “show time”.

Diagram illustrating the processes involved in normalizing and transforming Customs data

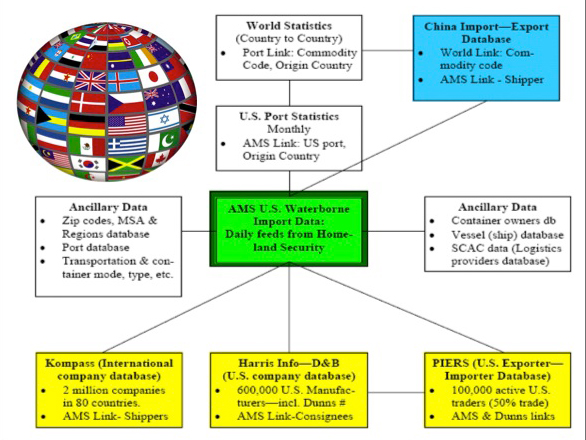
We found that the more relevant ancillary databases we were able to connect to the Customs data, the more dimensionalized and powerful the individual portraits of trade and the underlying traders became and the broader the business applications and potential.

Connecting the Dots. Ancillary data sources to Customs data.

Trade Intelligence begins with data. It is the fundamental building block from which dynamic business applications are crafted.  To make delicious, even digestible Trade Intelligence you must adhere to some basic steps.

  1. Get good, accurate, timely data.
  2. Scrub it up, remove the “dirt”.
  3. Mix it with other good data.
  4. Cook it well.
  5. Serve it with style.

Deriving Digestible Trade Intelligence from Customs Data takes finesse and diligence

At CenTradeX, we worked with many clients to develop innovative International Trade Solutions, some of which incorporated daily transactional Customs data toward the objective of assisting their staff and customers to find and take advantage of global business opportunities both here and abroad.  Several of our applications, namely Prospects (and its hybrid interface for the financial community – Trade Finance) and Stats Plus were acquired and now marketed by UBM Global Trade /PIERS.

Prospects, Trade Finance & Stats Plus; T.I. Applications developed by CenTradeX, acquired now marketed by PIERS

Several other Trade Information providers have developed some very powerful and cool applications incorporating U.S. Customs data.  Check out the top navigational menu of this site under T.I. Providers Links> Transactional, Article Categories> Suppliers as well as Trade Blogs> T.I. Providers and Video Library> T.I. Providers for more information on these companies and the products and services they offer.

Also, please refer to our Commercial Services Menu on the top navigational bar of this site for information on Application Licensing, Research & Writing ServicesDatabase Repositories, Artificial Intelligence Engine as well as other Consulting, Project Management and Application Development Services.

U.S. Customs Data Primer Part 3: The Devil (or a Worthwhile Treasure) is in the Details

Let’s go back to the intrinsic nature of the U.S. Customs Data itself.

U.S. Customs data is gathered electronically through the AMS (Automatic Manifest System), for sea, air and rail. However, only waterborne manifests are available publicly.  Each daily tally contains detailed records of the tens of thousands of shipments that arrive at U.S. ports, many millions of shipments each year.  Since we are a country of consumers and most imports arrive via ship, U.S. Customs Waterborne Import data represents MOST of our trade activity… to the tune of $1 trillion annually.

In spite of its inherent shortcomings, pause to appreciate the fact that detailed records of virtually every waterborne shipment, every foreign seller, every corresponding U.S. buyer, every product and component, every carrier, every port, for every day is made available publicly.  The potential value contained therein is staggering.  Most countries (perhaps wisely) don’t publish such information.  In some countries releasing such information would be /is a capital offense.

First of all, U.S. Customs data comes as a “flat file”.  It is not conveniently delimited for easy assimilation.  For each and every Bill of Lading (BOL) the respective data fields have a reserved number of characters rigidly assigned; some fields are filled with interesting data, others remain completely empty.  Analogous to a train hauling rail cars of varying lengths, each BOL must have its fields carefully unloaded and organized.  One mishandled BOL field can wreak havoc with accurate assimilation and analysis of the data.

For instance, there is a very important single character field contained in the data string that signifies whether the proceeding data for the BOL is original and new or whether it represents a revision of an already processed BOL (from a previous day!).  I have seen cases where there are several dozen revisions published to a single record occurring over a span of several months!

If not accounted for, you have multiple (and inaccurate) shipments counts.  The difficulty is that the only way to adequately correct the problem is to go back into already processed and published data to completely erase and replace the previous record or retain the inaccuracy.

Another significant problem is that there are many times multiple containers for one BOL AND/OR multiple BOLs for one container (LCL –less than container loads).  If not prudently accounted for there will be huge discrepancies when calculating TEUs (the standard measure for shipment volumes).

Implications?  If you are evaluating whether or not to construct a new distribution center, expand port capacity, open up a freight forwarding office, evaluate economic development, perform competitive analyses on a particular U.S. buyer or foreign seller, or deconstruct and improve supply chain logistics, what you don’t know or what you think you know (but is really fictitious) can kill you.

U.S. Customs Data Primer Part 2: “Holes” in the Data & Other Frustrating Anomalies

Once you know where the holes are, many times you can fill some of them. U.S. Census (statistical) data – which is published on a monthly basis – can give you an accurate measure of the value, number of units (and thus by computation the average cost per unit), country of origin and U.S. port for a particular product grouping (arranged within the Harmonized Tariff System) and method of transport (air, water, and again by computation “other” which would typically be rail /truck from Canada or Mexico).

Unfortunately, U.S. Customs data and U.S. Census data are asynchronous in many important ways.  For reasons beyond the scope of this article, it is impossible to take a record of all waterborne shipments for the month of January from U.S. Customs and seamlessly overlay it with the aggregate statistical record of imports provided by U.S. Census.  Further, the HS product categorization system is many times either too specific or too broad to apply.

Another problem is that several thousand U.S. importers and their corresponding foreign suppliers have been “suppressed” from appearing in the U.S. Customs data publications through the “trade secrets” exclusion to the Freedom of Information Act.  This “suppression” results in about 1/7 of all shipment records having blank fields where the “foreign shipper” and “U.S. importer” identification would normally be.

Again, once you know where the holes are, there are ways to work around them.  Wal-Mart is an obvious entity that attempts to mask its supply chain activities and valuable suppliers.  Notwithstanding, in a landmark report done on the “tainted toy” fiasco several years ago, we were able to extract 40,000 imported shipments of toys by Wal-Mart (of the 400,000 we retrieved) over an 18 month period of time.

How? Several methods. Although presumably “suppressed”, tens of thousands of transactions slip through the filtering methods applied by U.S. Customs technologies. Port pairs (matching foreign port with U.S. port) for a particular product also yield significant dividends.  The “product description” and “marks and numbers” fields contained on the shipping manifest sometimes contain references to either Wal-Mart or one of its known suppliers.  Product identification information – SKUs, trademarks, etc.- are also sometimes found.

It’s all a matter of sleuthing: trying to put together a complex puzzle from the resources at hand.  In the end, it’s an imperfect world with incomplete data.  However, with some effort, technological tools, multiple data sources along with intelligence and knowledge, you can discover an amazing amount of very valuable trade /business intelligence.  You just need to increase your awareness in order to align your expectations to what’s real and possible.

U.S. Customs Data Primer Part 1: You Can’t Always Get What You Want… BUT

Most people seem to want what they don’t have.  I guess it’s human nature.  It’s that way with trade intelligence. Folks want to extract more information from it than what is intrinsically possible.  You just can’t get soda pop from milking a cow.

You aren’t going to get a complete picture of importers, supply chain, current inventory, shipment valuations and intrastate transport patterns from U.S. Customs data.  However, just because you can’t have everything, doesn’t mean you can’t get a lot.  As Mick Jagger sang, “You can’t always get what you want, but if you try sometime, you may find, you get what you need.”

To understand what you can and can’t get from U.S. Customs data… we need to dig into what it is and why it is… what it has and what it doesn’t have… what current T.I. providers are doing to enhance the base data…  where the holes are and how best to fill them.
U.S. Customs, now under the auspices of Homeland Security, requires detailed documentation of all waterborne shipments entering into the United States.  This information must be filed 24 hours before the shipment disembarks from its originating foreign port.

Once the carriers dock at their respective domestic port, each day’s documentation of shipments (midnight cut off point) is published and distributed via FTP (used to be sent via overnight on a DVD) to awaiting subscribers (of which there are only a couple handfuls). This is made available through the Freedom of Information Act.

First of all, with the exception of UBM Global Trade /PIERS, who has special reciprocal information exchange deals with many ports and carriers as well as a cadre of data gathers assigned to many U.S. ports, only daily transactional data on U.S. IMPORTS is available, NOT EXPORTS.  Thus, as a U.S. manufacturer, you aren’t going to find a list of foreign buyers for your particular product within the confines of U.S. Customs data.

Secondly, only commodities and products that enter the U.S. via SHIP (waterborne freight both containerized and non-containerized) are accounted for.  Shipments that come via TRUCK or RAIL, let’s say from our North American neighbors – Canada or Mexico – are invisible.  Also absent are shipments that come via AIR.

Therefore, if you’re looking for U.S. Customs data to provide information on shipments of high-tech components, you’re going to be very disappointed (because they are mostly shipped by air).  If you want competitive intelligence on a company who largely imports from suppliers in Mexico, again, you’re going to become very frustrated.  If you’re after an accurate analysis of all foreign suppliers and U.S. importers for a particular component that may have originated from several countries (including our NAFTA neighbors) and shipped by multiple means (air, rail, truck, ship), it just isn’t going to happen.  There are going to be huge, gaping holes in your report.

Available U.S. Customs data ONLY details inbound waterborne shipments, NOT U.S. exports and NOT trade activity by rail, truck or air.

Understanding the Harmonized TARIFF System Classification of Products for Import-Export

The official language of international merchandise trade exists within a Harmonized System of product codes; “a tariff nomenclature (which) is an internationally standardized system of names and numbers for classifying traded products developed and maintained by the World Customs Organization (WCO)…  [used by] more than 200 countries, customs and economic unions, representing more than 98% of world trade.”

The HS (sometimes called HTS for Harmonized TARIFF System) is organized in 21 sections and 96 chapters. The 96 top-level two digit categories (let’s call them “parents”) form a hierarchical lineage containing over 1,000 four digit children and some 6,000 six digit grandchildren.  “To ensure harmonization, the contracting parties (countries) must employ all 4- and 6-digit provisions and the international rules and notes without deviation, but are free to adopt additional subcategories and notes.”

A familiar idiom states, “Give the devil his due”.  The primary reason behind the HTS system of product identification, besides providing a common reference point for trading purposes, is taxation.  It’s the all important middle “T” in HTS.  Although Tariffs & Duties can be applied to both imports and exports, “Tariffs are usually associated with protectionism, a government’s policy of controlling trade between nations to support the interests of its own citizens. For economic reasons, tariffs are usually imposed on imported goods.”

Each country further applies additional sub-categories beneath the universally agreed upon 6 digit HS provisions in order to track more precisely the commodities and products they are most interested in “protecting”; i.e. monitoring and taxing.  These subcategories (great-grandchildren, great-great grandchildren, etc.) can generate branches of 8, 10, 12 or more digits.  “The Harmonized Tariff Schedule of the United States (HTS) is the primary resource for determining tariff classifications for goods imported into the United States (and can also be used in place of Schedule B for classifying goods exported from the United States)”.  There are over 17,000 unique ten-digit HTS classification code numbers.

Example of the Harmonized TARIFF System

One of the very first tasks that many Trade Consultants undertake in working with a newbie importing or exporting company is to help them assign the appropriate HTS codes to their respective product(s).  Most U.S. companies don’t have a clue.  In China, I think they learn the HS system in elementary school along with English.  Improperly classified products are likely to have a very difficult journey through Customs and incur additional costs.

One of the biggest problems in the process of transforming trade data into trade intelligence is inherent in the HTS nomenclature.  It is extremely obtuse.  The descriptions are almost impossible to understand.  The classification “logic” varies from chapter to chapter, category to category.  The most commonly used term is the ever endearing and everlasting designation: NESOI.  No, it’s not a type of plastic, article of clothing or technological component.  It means, NOT Elsewhere Specified Or Indicated.  World-wide imports and exports of NESOI have experienced exponential growth during the last 10-20 years during the information age.

By and large it’s all a form of Trade Technocracy, a malady which I have spent a sizable portion of my tenure as a Trade Intelligence Professional attempting to remedy.

Trade Statistics: Discovering Market Opportunities Through Research & Analysis

What can you do with Global Trade Flow Statistics?  What can the numbers tell you?  Think of it like getting to know a person.  Each person has a story.  Each product that is bought or sold has a story too.  The big picture of international trade is composed of many millions of individual stories woven together into a huge, ever-changing tapestry.  Global Trade Flow Statistics are like “vitals”.

When you go to a doctor, he/she checks weight, blood pressure, temperature, etc.  These pieces of data provide the foundation for understanding your particular situation.  After the preliminaries are completed, you will be asked additional questions in order to assess your individual condition.  Perhaps x-rays, blood tests or another specialist examination will be called for.  Each vital statistic is evaluated in combination and in context (with the aid of experts) in order to render a proper diagnosis and treatment plan.

Global Trade Flow Statistics (about what has been, is currently and what is expected to be bought or sold by a particular country of your respective product) are vital pieces of information. They not only establish a fundamental knowledge of the situation, but also provide the necessary clues about what other data is required. Collecting, comparing, analyzing and reporting this and accompanying data are called Market Research.

No would-be (intelligent) exporter or importer of products or raw materials should attempt to conduct business without it.  It would be similar to dispensing a prescription without a thorough examination.  You might guess right more times than not, particularly if you consider yourself to have “street smarts”, but the cost of not knowing what you don’t know can be considerable.

Statistical Analysis can provide snap shots from the front line of the "Trade War"

Many times, the most important information that can be gleaned from statistical analysis is more questions.  I remember stumbling upon a 10,000% jump in annual shipments of auto parts from the U.S. to an obscure African country.  Further investigation revealed that, to circumvent the trade embargo imposed upon South Africa, U.S. shipments were being rerouted through an adjacent nation.

Another anomaly I remember was the exponential increase in imports by the U.S. of Chilean Salmon.  Market research conducted for an entrepreneurial friend of mine, revealed that 98% of Chilean salmon shipments came into Miami, took several days to clear customs and then several more days to be trucked to destinations north.  His plan was to establish direct flights into Nashville, reroute distribution and save almost a week.  In the world of a fresh, perishable commodity like fish, that’s an eternity.

At CenTradeX, I developed dynamically generated reports that illustrated the trade balance (comparing exports with imports) for any particular product between any chosen trading partners (countries) over a 20 year period.  With 6,000 product categories and 200 countries that generated over 1,000,000 snapshots, it was easy to observe, if “trade war” is a metaphor you are comfortable with, exports representing money (green) and imports representing (red) how the U.S. has been faring, economically speaking, (soldier by soldier/product by product) with China over  time.

Global Trade Flow Statistics: Take a Look at the Big Picture

It all starts with the data.  Data is THE fundamental building block used in constructing Trade Intelligence.  Trade Intelligence, in one form or another, is the guide map used to navigate trillions of dollars of exchanges in goods and services by every year.  WorldTradeDaily.com is dedicated exclusively to the matter of Trade Intelligence.

Let’s take a look at Global Trade Flow Statistics particularly merchandise (versus services) trade.  First of all, it’s easy to forget when looking at the numbers, that beneath all the digits and commas are real people, companies, jobs, business relationships, political agendas, and the prosperity (or lack thereof) of countries and regions.

Specifically, Global Trade Flow Statistics, organized within the hierarchy of roughly 6,000 commonly used and agreed upon product (HS) codes, track the imports and exports between each of 200 countries. The respective governing (and taxing) authority for each government collects, aggregates and (usually through an associated entity) disseminates statistical information on their trade activities at least once per year.  Many, like the U.S. and Europe, release data monthly.

The numbers reflect the total import or export value for each of 6,000 (six digit HS) product categories, which of course is easily aggregated to the four-digit parent grouping (around 1,200) and the 90+ (two digit) grandparent classes.  They also document the number of units sold, whatever type unit, item, case, container, pallet, or barrel is being referred to.  Obviously, cost per unit can be derived from dividing the value by the number of units bought or sold.

You can obtain this information on virtually every country on the planet with a few exceptions. For instance, Taiwan is not officially recognized by the United Nations as a separate country for publication purposes.  You won’t find Palestine’s imports and exports either.  The U.S. releases trade flow statistics every month trailing around 45 days.  For handfuls of developing countries you may have to wait a year or two before you see trade figures.

Some countries maintain their own special rules for what they consider a documentable (and therefore reportable) export or import.  Of particular note are China and several Middle East countries.  China doesn’t report products manufactured and exported by foreign-owned companies as exports.  Therefore, you will quickly discover HUGE discrepancies between what China reports they export to –let’s say the U.S. -versus what the U.S. proclaims they import from China.

Consequently, the truth about burgeoning trade deficits and trade imbalance along with the associated political and economic bantering about such things, needs to be reviewed in the light of underlying definitions.  It is said, “Information is power”. Many of the specifics about trade transactions are carefully guarded government secrets.  China, Inc. is closer to true than not.

The reality is that International Trade is the indisputable foundation for economic growth and prosperity.  Global Trade Flow Statistics aren’t just obtuse and academic, they are historically relevant, currently pertinent and provide clues to future opportunities and trends that can inform and prosper the wise.

Special Report: Trade Research. Finding the HS Code & Getting Some Data

While taking a much-needed vacation in the Dominican Republic, I ended up being “commissioned” by a fellow vacationer to conduct a research study into the scooter (little motorcycles under 50cc) market.  Although my girlfriend and I dispensed with computers, cell phones and all other electronics, I guess it’s harder to totally turn off the business side of the brain.  I do confess though that it is somewhat recreational to engage in entrepreneurial deliberations over excessive inebriation.  Anyway, I thought to share some steps that can help any newbie researcher to analyze a product for import.  We’ll start with getting some basic data.

Step One: In order to retrieve data about a product, you must find the appropriate harmonized classification for that item.  The Harmonized code for Mopeds is 871110. Remember, 6 digits is the most specificity you can uniformly retrieve for either exports or imports.  Beyond 6 digits there are variations from country to country on classification.  You can try to find the code via Google. Typing in the words: “Harmonized Code, scooter, under 50cc” brings back a set a results from which it is easy to lift the harmonized code.

You can also try a more formal approach such as visiting the U.S. Census Bureau tariff search site.  The words: scooter or moped return a screen that asks the user to choose between the following categories:

  • <= 50 cc (871110)
  • > 50 and <= 250 cc (871120)
  • > 250 and <= 500 cc (871130)
  • > 500 and <= 800 cc (871140)
  • > 800 cc (871150)

The International Trade Commission offers a comprehensive catalog by which users can drill down into the fine details of a particular harmonized code by chapter and verse.

To continue, each of the 6,000 six digit harmonized product classifications are organized within a parent – child – grandchild hierarchy.  Each “family” has its own set of rules and criteria under which subclassifications are created.  In the case of motorcycles 8711, its parent – the grandfather of the family – is 87 Vehicles.  Motorcycle’s offspring are organized by size from the littlest of the brood: 87.11.10 (equal to or less than 50cc) to big  bikes: 87.11.50 (the hunkiest of the gang).  Although not displayed in the Census results, there is another grandchild, which is also in most of the families designated by the xx.xx.90 designation: 871190: other.

Step Two: Getting the export values from Census is simple. Basically we export about $24-25 million in scooters (mopeds) annually.

U.S. Scooters Exports

Step Three: Getting the import values, through the ITC DataWeb interface is a real pain. You first have to register and then go through an agonizing process to define and retrieve a report.  UGH! So painful and laborious. It’s free at least.

Step Four: So, what does the data tell us?  Well, for one thing scooter imports dropped drastically from 2008 to 2009 – by 60%, then by another 50% between 2009 to 2010. Wow. Plummeting from $140 million to $29 million is rather significant.  YTD (January through May 2010-2011) reveals that imports are rebounding though, seeing almost a 400% increase over the same period last year.

Just so happens that our friends over at Zepol have produced a much friendlier, easier to get and easier tounderstand recap. Click this link for an updated chart.

Zepol depiction of Scooter imports and exports

Zepol’s rendition beautifully illustrates that the increase in imports gathered steam in recent months.  It also goes to show that the instruments offered for free by the U.S. Government are world’s behind those available through reputable TI providers.

Suppliers of Global Trade Flow Statistics: United Nations, GTIS & WISER

The most accessible and inexpensive source for global trade flow statistics is the United Nations.  Through their COMTRADE database, users are free to search for and download data on the imports and exports of products classified in over 6,000 categories (in the Harmonized System) between almost 200 reporting countries.  The same data is also available in other product classification systems (like the ISIC and SITC) for some countries.

The statistics are gathered and disseminated, as they are received, on an annual basis.  With some countries the time lag is only several months following year-end, while others take a year or two to report.  The dataset depicts trade value, number of units bought or sold and trading partner (corresponding country) for each given year.  The U.N. maintains (and makes available to the public) historic records of each country’s trade activity up to several decades back.

Users are limited to the number of records they are able to download at one time without cost.  However, the U.N. offers an inexpensive paid subscription option that provides unlimited search and download capability of all their trade databases.  The corresponding interface allows users to save their search queries for later use as well as set up alerts with automatic download of updated data.

U.N. ComTrade Database is usually the first place to go for Global Trade Statistics.

The only negatives are the lack of specificity and recency. The U.N. data only reflects aggregated annualized figures. Updates are sometimes spotty and infrequent. The data contains only the basest attributes of value, flow (import or export) partner (country) and unit of measure as well as other derivative statistical information therein contained (category sums, cost-per-unit, etc).

If you want greater specificity and frequency, you will need to turn to other sources.  GTIS (Global Trade Information Services) and WISER Trade (World Institute for Strategic Economic Research)  (They used to be called MISER.) These sources have gone through the sometimes complicated processes of obtaining trade data directly from the individual countries as soon as it is made available – sometimes monthly.  The countries where they don’t get “special” data, they fill in with U.N. /ComTrade data, FYI.

Of course, individuals and organizations have the option of apprehending the same information (that GTIS or WISER sells) fairly easily, at least on 50% -60% of the countries.  U.S. Census sells import/export merchandise trade flow statistics for a couple hundred dollars.  EuroStat, releases similar information at no or low cost.  Obtaining Japan trade data is a simple matter as well.  Therefore, 80% of the worldwide merchandise trade, conducted by the countries referenced above, can be obtained and analyzed on a monthly basis at minimal cost.

What one abandons by such efforts are the technologies and convenient user search and reporting tools that have been developed by GTIS, WISER and several other Trade Intelligence providers, many of which are finally integrating aspects of Global Trade Flow Statistics into their particular product interfaces.  On the other hand, for maximum flexibility, versatility and veracity in utilizing data for specific analyses, reporting and applications, one may be best served by going directly to the sources.

U.S. Census Bureau – Division of Foreign Trade (USCB-FT) Offers Many Statistical Products

The best source for U.S. Trade flow statistics, if you want them in the purest, rawest form, is the U.S. Census Bureau – Division of Foreign Trade (USCB-FT).  Trade Statistics are the bread and butter of Trade Intelligence.  Several TI Providers, namely GTIS and Wiser Trade, have made a business from superimposing their particular brand of searching/reporting engine atop of said data, but for the greatest versatility and analytical capability, one is best to start at the source.

USCB-FT collects, aggregates, slices, dices and disseminates data collected on and about U.S. international import and export transactions.  As they state, “The United States Code, Title 13, requires this program. Participation is mandatory. The Treasury Department assists in the conduct of this program.”  Yup, if you’re going to buy or sell anything valued at $2,000 (imports) or $2,500 (exports) or more overseas you must pay homage to the Feds. Paperwork makes the world go around.

In whatever form the resulting (aggregated) transactional trade data is presented, USCB-FT takes special care to prevent anyone from being able to link the statistics to the underlying companies. It is one, if not THE, primary objective of your neighborhood Trade Intelligence Supplier to disaggregate this data and reconnect the dots obscured by the U.S. Government. It takes sophisticated technology, other data sources, lots of hard work, clever sleuthing and a bit of luck, but it can be done. But I do digress.

Back to basics. USCB-FT serves up a yummy variety of statistical delicacies in several schedules and venues (available for either imports or exports) including:

The above list of Data are compiled in terms of commodity classification, quantities, values, shipping weights, methods of transportation (air or vessel), customs district, customs port, country of origin (or destination).

  • In the case of exports – state of (movement) origin and whether contents are domestic goods or re-exports.
  • In the case of imports – market share, unit prices, import charges and duties collected.
Back in the day, hungry recipients would have to pace impatiently awaiting the release and delivery of their monthly data dinner.  Now, subscribers can simply download their respective selection(s) immediately and directly from the U.S. Census data cafe.  Why trade statistics are important, to what ends this data is employed, understanding the intricacies of information and how it can be combined with other data sources to provide a more complete picture of world trade shall be left for another post at another time.

Pay With Bitcoin

WorldTradeDaily.com Completed Its First Year of Publication. What’s Up for the Coming Year?

We concluded our first year of consecutive daily publishing with the announcement of a new format and focus: We’re going to be conducting extensive coverage of the $2 trillion of annual U.S. Import Trade.

For the past 120 days, prior to our September 1st launch of WTD 2.0, while we are busily compiling the extensive background data required for this project (and looking for a commercial sponsor and University partner), we republished selected articles from the previous year.

Please check out the complete details in several of our recent articles:

However, over the last several months, in discussion with several of our advisors, we have further refined our intention.  Specifically, we want to address U.S. Waterborne Import Trade.  There are several reasons behind this decision.  First of all, two-thirds of all U.S. import trade is waterborne.  Secondly, transactional data is only available for waterborne imports.  Taken together with statistical and company data the three-fold combination is powerful.  Therefore, if we focus on U.S. Waterborne Import Trade, we will be able to provide granular shipment detail, lists of both foreign suppliers and U.S. importers as well as trend analysis and strategic statistical overview… in each and every article… comprehensively representing every significant imported (via Water/ by Vessel) product.

Our plan is that during the 250 or so weekdays (Monday – Friday) of the forthcoming year (commending August 1st), we will report on specific products and commodities within the major (4 digit) product groups (those exceeding $1 billion dollars).  There are 170 product groups (of the 1250 total) that fit within this threshold thus together our selected product groups represent over $1 trillion of annual U.S. waterborne import trade.

In each story, we will expand upon the highest ranked (by import dollar volume) 6 digit sub-category within its respective 4 digit (billion dollar) parent.  In cases in which a particular 4 digit product heading has more than one billion dollar 6 digit “child” subcategory, we will develop an article for that product as well.

The purpose behind focusing articles on the top ranked 6 digit codes is that it lends to the greatest amount of specificity and business application. By covering the largest couple of hundred products individually, we will develop – over the course of one year – the most comprehensive (and hopefully useful) detailed analysis of U.S. Waterborne Import Trade available.

Those 4 digit Product groups that fall below the billion dollar threshold will be covered in summary fashion within their respective HS section or HS chapter heading for which we plan to dedicate a couple of dozen additional stories.

The graph below depicts a sample of the products for which we will be developing individual articles.  We have intentionally groomed the list as to eliminate all but the top 6,000 plus HS 6 digit products.

Sample of U.S. Waterborne Import trade product groupings to be developed into individual articles

Under HS Chapter 20, “Prepared Vegetables & Fruits” (Approx. $6.5 billion total import trade of which $4.6 billion came via water):

  • 4 digit product group 2008 “Prepared Fruits & Nuts” is ranked in excess of $1 billion waterborne import trade but doesn’t have any billion dollar 6 digit “babies”; therefore we will choose one or     both of the largest sub-groupings (Pineapples and/or Citrus Fruit) to develop.
  • Apple Juice ($672,868,720) is the largest sub-category under 2009 “Fruit Juice”, therefore it will be the subject of an article.

Under Chapter 22 “Beverages & Spirits” we will develop a handful of articles.

  • For 2202; 220210 – “Flavored Waters” ($1,043,205,967 waterborne imports)
  • Under 2203; 220300 Beer ($1,703,419,096 waterborne imports)
  • Under 2208, there are two sub-categories of $1 billion each: Whiskies and Vodka. Therefore we will dedicate an article to each.

Chapter 24 Tobacco, although it generated $1,273,160,265 in Waterborne imports, doesn’t contain any 4 digit product categories in excess of $1 billion.  Therefore it will be covered in our HS section and HS chapter summaries.

Notwithstanding our focus on U.S. Waterborne Import Trade, we will continue to reserve weekend articles to pertinent international trade and economic news, op-ed pieces and articles contributed by our WTD community of readers.  That’s the plan for now.

WTD 2.0 Coming September 1, 2012 Will Focus on $2 Trillion of U.S. Import Trade Flows

All products that are traded internationally are categorized within a common taxonomy called the “harmonized system”  This hierarchical schema consists of 21 sections, 98 (2 digit) chapters, 1250+ (4 digit) product groups, broken down into 6,000+ commodities and products.  These identifiers represent the agreed upon common “international language” of product trade.  Beyond the above, each country maintains its own unique sub-classifications (8,10,12, 15 digits) which are utilized for organizational, policy and tax (tariff) purposes.

Behind the statistics, analyses and facts about a specific commodity or product category, there is a wealth of valuable related information which can be gleaned and expanded upon about the locales (economic impact on countries, cities, communities) and companies (specifics on the foreign manufacturers, U.S. importers and trade service providers such as ports, carriers and NVOCCs).  Over the previous year, we published dozens of trade reports featuring various aspects of this mix including metro, country, product, company and historic trends.  Click this link to view a summary of all trade reports written by Isaac Thompson, who interned for WorldTradeDaily.com during this last semester.

So the plan is to report on ALL $2 trillion of product inflows within one year.  How this breaks down is as follows.  Every 4 digit product group that exceeds $2 billion (representing 1% or more of the total) we will dedicate a specific article to.  There are over 160 (out of 1250+) of these. Together they represent over 80% of U.S. Import trade.  In addition, we will cover every 2 digit HS chapter along with their corresponding 4 digit product groups under $2 billion.  In cases where the trade volume of the 2 digit chapter doesn’t merit individual attention, we will group them together for representation in a section article.  Thus, within the 250 – 260 planned week day articles, we should cover all product categories.

Taken together, it will represent a comprehensive portrayal of U.S. import trade, trading partners, and marketplace trends.  Hopefully, it will provide significant strategic knowledge with valuable business application, globally.  This comprehensive, if complex portrait of U.S. Import Trade is available for download via our Google Docs site

If the project continues beyond the initial year we can develop articles on lower ranked product groups (in the $250 million to $2 billion range) within the U.S. Import Trade flow perspective. We could take an alternate point of view, perhaps focusing globally on products equalling or exceeding a particular value threshold.  We could revisit the same product groups by expanding upon the trading partners and supply chain aspects of each.  We could increase the specificity (down to the 6 digit HS level) of the articles and address products /commodities of a particular threshold or angle (such as exports by China or BRIC countries). We could cover the several $trillion in global “services” trade.  Obviously, our university partner and commercial sponsor  together with reader feedback and interest within the context of available resources, will help guide our direction.

WorldTradeDaily.com Concludes First Year of Publication with Launch of WTD 2.0

WorldTradeDaily.com celebrated its one year anniversary May 1st, 2012   365 days of consecutive publication.  During the year we have undergone several evolutions in focus, content and design.  The breadth and depth of our viewership has correspondingly enlarged.  Half of our readers live outside the U.S. from over 120 countries.  This is important to us, since we strive to maintain a global, non ethnocentric viewpoint and provide value to an international audience.

I launched WorldTradeDaily.com with several ideas in mind, some personal some commercial.  Commercially, I sought to extract value from the assets retained (database repositories, artificial intelligence engine, application licenses) following the UBM Global Trade/ PIERS acquisition as well as my consulting and application development services.  Personally, I sustain a passion for international trade, making an impact, creating cool technologies and applications, and working with talented people.  WTD provided a forum and platform to explore and promote those ideas and ideals.

What now?  Well, the ideas and ideals remain the same. We’d like to further enhance the content and expand the reach.  Finding an appropriate commercial sponsor and partnering University would accelerate the process to be sure.

We concluded our first year’s publication with interviews and observations from the 25th Annual NASBITE (National Association of Small Business and International Trade Educators) conference.  Throughout the next couple of months, we will republish selected articles from the previous year, while redesigning the website and restructuring business operations. Commencing in July/August, we intend to launch WTD 2.0.  ideally incorporating daily video stories in addition to new article content. WorldTradeDaily.com will remain true to its motto: “Uncovering and Reporting on the Stories Buried Within International Trade Data… Every Day.”

Throughout the subsequent year, we will report on Products–  at least during the 250+ week days (Monday – Friday) – while presenting pertinent international trade and economic news stories on the 100+ weekend days.

Specifically, we will dig deep into the $2 trillion+ of annual U.S. import flows. There are a number of reasons for this.  The U.S. market is considered one of the easiest markets to access for overseas suppliers.  Relevant information on what, how much, when is bought by who is very valuable information for existing or prospective foreign manufacturers.  Also, U.S. companies gain strategic advantage by sourcing well and keeping up to date.  In addition, a plethora of data exists – including U.S. Customs Waterborne Import Shipping Manifest data (which is transactional and daily)  – that can greatly aid in “uncovering and reporting” on the valuable “stories buried within”.  Lastly, there are a handful of valuable sources providing assistance and analysis on U.S. Exports, and not as many representing and looking at U.S. Imports and Importers.

The following are example of previous trade reports. Click on the image to view the respective article. Click this link to view a summary of all trade reports written by Isaac Thompson, who interned for     WorldTradeDaily.com during this last semester.

Banana Product Report

Atlanta Metro Report

Coca Cola Company Report

Tunisia Country Trend Report

Proposal for the License of World Trade Daily Database Repositories & Technologies

Recently, we have received several inquiries regarding the purchase of our database repositories and technologies.  Therefore, I thought it pertinent to publish one of our proposals as an example of several options we are able to offer.  Options outlined below range from the simple acquisition of parsed, normalized historical U.S. Customs data to the purchase /licensing and integration of our advanced Artificial Intelligence engine, accompanying technologies and related data repositories.

For an outline on the development of our innovative technologies check out this recent article. You may also want to check out our article on our database repositories and artificial intelligence engine.

Proposal for the purchase (licensing) of a complete duplicate normalized copy of the U.S. Customs AMS Waterborne Import Shipment databases. February 6, 2012.

We have used the actual cost of the raw data from U.S. Customs as a yard stick by which to establish valuation… without the attribution of processing, enhancements, related databases, or associated technologies.

The base cost of Raw Data from U.S. Customs/DHS for 1 year (365 days @$100 per day) is $36,500.  The complete historical CenTradeX /World Trade Daily Customs Data Collection- acquired and processed daily from January 1, 2006 through August 18, 2010- cost us $160,900 (1,690 days @ $100).

Based upon this cost-value assumption, we have established the following framework for (non exclusive) licensing /purchase.

Option 1. Acquisition of processed, parsed, normalized data in a relational database without the addition associated company or reference databases; i.e. AMSTradeDataImport, along with three sub-options.

a. 1 year data (365 days) @ 33.3% base cost = $12,045
b. 2 years data (730 days) @ 25% base cost = $18,250
c. Complete Data collection of over 4 1/2 years data (1,690 days) @ 15% base cost = $24,135*

*The third option “c” comes with complimentary licenses to the Stats Plus or Prospects trade application for one year, subject to the PIERS EUA.

Option 2. Acquisition of the above ALONG WITH associated relational reference tables and international trade company databases; AMSReporting2 and associated tables as required.**

Please note that this option is only available for option “C” (the complete data collection) and will be calculated @ 30% base cost of raw Customs data (double the 15% factor outlined in 1.c.) = $48,270 total. This figure represents the total cost for both the complete Customs data collection AND all associated reference  and company databases; NOT an amount added to the rate outlined in option “1.c.”

**Option 2 also includes a complementary one year PIERS license to either Prospects or Stats Plus as well as 20 hours of my consulting time on a complimentary, i.e. free, basis.

Option 3.  Licensing of our A.I. (Artificial Intelligence) Engine – along with all scripts, documentation and associated databases needed to import, process and normalize new Customs data and connect it to company databases and reference tables.***

This option is only available with the acquisition of the complete Customs data collection (“1 -c”) AND (Option 2) associated company databases; i.e. AMSTradeDataImport, AMSReporting2, and other files as required. Pricing shall be calculated @60% base cost of raw Customs data (double 30% factor outlined in option #2) = $96,540* total. Again, this is total cost, not a cost in addition to the amount outlined in options #1 & 2.

***Option #3 will include 2 complimentary three-year licenses (through June 30, 2015); one for Stats Plus and one for Prospects, subject to the PIERS EUA. In addition, this option also includes 80 hours of my consulting time, to be arranged within a mutually agreeable schedule.

A fourth option, not outlined above, calls for the outright sale of our existing technologies and database repositories (on an exclusive basis) for $500,000.  Consulting and application development services, if required, would be additional.  Below, please find a diagram that depicts the process of transforming raw Customs data into Trade Intelligence.

  The Journey of Customs Data Transformation from Raw data to Trade Intelligence.

Solar Turbines Exports: Countries of Destination and Top Commodities

This report covers Solar Turbines Inc. one of the largest exporters in the U.S. and a wholly owned subsidiary of Caterpillar Inc. We cover export shipments by destination and value. We finish with an example of the top commodities sold by Solar Turbines.

Solar Turbines Inc.

Solar Turbines Incorporated was 44th on the Fortune 500 list in 2009. Solar Turbines was bought by Caterpillar in 1981 and has roughly 5,500 employees. The main products that Solar Turbines produce are axial-flow industrial engines. Solar Turbine has more than 13,000 gas turbine systems. Some of the more popular products are called Saturn, Centaur, Taurus, Mars, and Titan. Solar Turbines products are used in oil and gas production and transmission, and power generation. The gas turbine engines range from 1600 horsepower to 30,000 horsepower.  Solar Turbines is one of the 50 largest exporters in the United States and is located in San Diego (click here for San Diego trade profile).

Solar Turbines Inc. exports by country, rank listed by estimated value. Top buying countries are Venezuela, India, Nigeria, and Belgium.

Solar Turbines Inc. exported over 145 shipments from April 2011 to January, 2012. These exports had an estimated value of over 82 million dollars. They went to mainly 11 countries. The largest buyer of Solar Turbines by worth was Venezuela, buying 28 million dollars worth in this time frame. The second largest buyer was India, who bought 15.9 million dollars worth. The third largest buyer was Nigeria and then Belgium. These four countries alone generated 84% of Solar Turbine’s export sales. Please note the table with the buying countries rank-listed by estimated value, followed by a pie chart / graph. The pie chart percentages represent the percent of total value exported to buying country.

Pie Chart of Solar Turbines Exports by country and percentage of total export value

Solar Turbine’s Exports by Commodity Value

Using a comprehensive data set of all 146 export shipments, 146 Bills of Lading, available here, we created a graph of the commodities sold by value. We found that the commodities matched the list provided by the company. The top commodity sold was HS: 850230, Generating Sets. This commodity generated 30 million dollars of sales from April 2011 to January 2012. HS: 841181 Gas Turbines of a power less than 5000 KW were exported for 15.9 million dollars. HS: 840790 Spark Ignition Rotary Combustion Engines provided another 11.3 million dollars in overseas sales. Below is a bar graph showing the major commodities by value.

   Bar Graph of Solar Turbines Exports of Generating Sets, Gas Turbines, Spark Ignition Rotary Combustion Engines export estimated value from April 2011 to Jan. 2012.

Coca-Cola: Imports by Origin, Commodity, and Shipping Trends

This report gives a brief on Coca-Cola imports. We document Coca-Cola’s imports to the United States by origin, commodity, and date received. We finish by offering a downloadable dataset of  Coca-Cola’s 11,003 BOLs covering 2011.

Coca-Cola

Coca-Cola is the best-selling soft drink in most countries and was recognized as the number one global brand in 2010. The Coca-Cola Company’s world headquarters is located in Atlanta, GA (click here for trade profile). Coca-Cola produces over 500 brands including: Coke, Diet Coke, Fanta, Sprite, 7 Up, Minute Maid, and Simply Orange. Coca-Cola employs around 139,000 people worldwide. According to the 2007 Annual Report, Coca-Cola sold 42% of its product by gallon in the United States and 37% in Mexico, India, Brazil, Japan, and China. The remaining 20% was sold throughout the rest of the world.

Coca-Cola Imports to the United States

Coca-Cola imported 1.4 billion dollars worth of product from December 2010 to December 2011. 11,003 shipments carried the products to the United States, 11,001 coming from Puerto Rico. Puerto Rico was the major source of Coca-Cola’s imports to the United States in 2011. 99% of these shipments arrived in Jacksonville, Florida.

  Imports of Coca-Cola from December 2010 to December 2011, country of origin and port where received

Coca-Cola Imports by Commodity

With PIERS Prospects we can break down these 11,000 shipments into imported commodity and estimated value. Drink mixtures, HS: 330210, by definition of the United States Census, odoriferous (distinct smelling) substances and mixtures of raw materials or preparations to be used for the manufacture of beverages, accounted for 4,000 of the shipments. Drink mixtures from Puerto Rico accounted for over 99% of Coca-Cola’s import value. A more detailed commodity description is available on the individual BOLs.  It states that these are beverage ingredients, phosphoric acid solutions, and bottler flavoring compounds.

Top Commodities imported by Coca-Cola in 2011 from Puerto Rico

Complete Coca-Cola BOL Dataset and Shipping Trend Chart

We can also view the data in the form of trends. Below is a line chart with the Coca-Cola shipping trends from Puerto Rico. It shows that March is the heaviest shipping time. For the complete dataset of Coca-Cola’s 11,003 shipping records, click here.

Line Graph:Chart Coca-Cola imports 2011 from Puerto Rico by month and number of shipments

Phoenix, Arizona: Metro World Trade Profile and Top Importers

Phoenix, Arizona MSA Companies

Phoenix, Arizona is United State’s sixth most populated city. Phoenix’s Metropolitan Statistical Area (MSA) is known as the Valley of the Sun and has a population of 4.2 million people. Phoenix, the  capital city of Arizona and home to Arizona State University, has many government supported employees. It is also home to a number of Fortune 500 companies such as: Allied Waste, Avnet, Apollo group, Freeport-McMoRan, PetSmart, Pinnacle West, and US Airways Group. Best Western and U-HAUL have headquarters in Arizona, while Intel and American Express both have a major presence in the city. Click this link for a full list of corporations that have a notable presence in Phoenix.

Exports

Phoenix MSA exports 18.6 billion annually, placing them as the 15th largest MSA exporter by value. 10% of the Gross Metropolitan Product is exported, supporting 150,000 jobs. Brookings Institute. International Trade Administration groups products by category. According to ITA, Phoenix’s largest exported product cluster is Computer and Electronic Products composing 46% of the total. This one category accounted for 2 billion dollars worth of exports in just half of 2010.

   Phoenix-Mesa-Scottsdale Arizona exports 2010 first half computer naics metropolitan exports billions chart graph pie computer electronic product manufacturing, transportation, machinery, chemical

Specific Companies’ Data 

With PIERS Prospects we can find specific Phoenix MSA importing and exporting companies. This data is made available for the specific location of Phoenix, Arizona. The top Phoenix importing companies by value are Conair, Petsmart Inc, Omnimount Systems, Asa Solutions, Alliance Beverage Distribution, and Intel Corporation.  Below is an excerpt from the excel master file with this information. The data sets include Phoenix MSA company names, street addresses, import and export values, commodity names, foreign sources, and more. Contact WTD if you have any questions. Click here to download the entire data set.

Top importers in Phoenix Arizona metro statistical area by value: Conair, Petsmart Omnimount, Asa, Alliance Beverage, Intel, Rockford, etc. waterborne foreign trade data excel file raw available download clip

Bridgeport, Connecticut MSA, World Trade Snapshot

Bridgeport, Connecticut MSA Trade Snapshot 

Bridgeport, Connecticut is located mainland, north, above New York City. Bridgeport is the center city of the larger Metropolitan Statistical Area (MSA) including Easton, Fairfield, Monroe, Stratford, and Trumbull. In 2009 this area was home to nine hundred thousand people, making it the 41st largest urban area in the United States just behind Austin, Texas.

Once a hub of industrial manufacturing, Bridgeport suffered deindustrialization during the 70s and 80s and subsequently altered markets. Bridgeport’s MSA today exports about 7.5 billon dollars worth of products annually, which ranks it as the 35th largest MSA exporter in the United States. 12% of the gross metropolitan product is exported.

Bridgeport’s Exports by Product Cluster

During the first half of 2010, 4.3 billion dollars worth of exports were sent out from Bridgeport MSA. The largest industrial cluster was chemical manufacturing, making up 21% of the total exports at a value of 900 million dollars. Transportation Equipment Manufacturing (15%) was the second largest, sending out 655 million dollars in the 6 month span. 2 billion dollars worth of Bridgeport’s MSA exports (51%) were comprised under the International Trade Administration’s (part of the U. S. Department of Commerce) manufacturing category of other.  A majority of Bridgeport exported products do not fall under a single NAICS. With PIERS we can get a clearer picture of what comprises “other”.

Bridgeport MSA Exports by Product Cluster NAICS export profile Equipment Manufacturing pie chart International Trade Administration U. S. Department of Commerce

Top Industries in Bridgeport MSA by Number of Shipments

With PIERS Prospects we can look at Bridgeport MSA shipments by umbrella standard industrial code (SIC). The top industry by shipments is paper mills, SIC 2621. Cutlery SIC 3421 is the second largest, followed by manufacturing industries SIC 3999, and then electric housewares and fans SIC 3634.

Top Industries in Bridgeport MSA by Number of Shipments chart standard industrialized code paper mills, cutlery manufacturing CT Connecticut table

Bridgeport, CT bucks the major national import trend of relying on China as the largest supplier of goods. If we look at shipments coming into the Bridgeport MSA by country, the number one country is surprisingly Norway. China is the second largest source of shipments arriving in Bridgeport, followed by Germany, France, and then Hong Kong. Since Norway is an unusual first place source for imported goods, it deserves a look into what kind of products and companies are shipping from Norway.

Top shipments by country into Bridgeport MSA 2010 2011 Greece, Hong Kong France, Germany, China, Norway imports container companies PIERS Prospects chart list

Top Companies Importing Norwegian Goods into Bridgeport MSA

With PIERS Prospects we can also view companies importing goods into specific United States locations by country of origin. In this case Norway was the number one source for imported goods into the Bridgeport MSA. The largest company bringing in these goods was Norske Skog (Usa) Inc. Their main product is paper which matches our industrial report above. There were more than 300 shipments of pure paper to Bridgeport from this one company. The second largest company was Norseland Incorporated which imports mainly cheese. With PIERS we can gain a much more in depth view on virtually any of these companies to include shipping trends, sources, bills of lading, executives, location, etc. Below are the top Norwegian companies importing into the Bridgeport MSA.

Norwegian companies importing into the Bridgport MSA shipments Teus rank bill of lading shipping trends 12 month company Norske Skog Norseland Incorporated chart list

Bananas, HS Code 0803; Import-Export Profile of Global and U.S. Trade

Bananas

Bananas, HS code 0803, are an essential part of many American’s diet, yet these fruits grow in the tropics and must be shipped a long distance to world markets. The United States only produces .008 million metric tones of bananas a year. India, the world’s leader, produced 26.2 million metric tones of bananas in 2009.

Top world producers of bananas by country 2009 India, China, Brazil, Costa Rico chart

They are followed by the Philippines, China, Ecuador, Brazil, Indonesia, and Mexico. Costa Rica is the world’s eight largest producer of bananas and Whole Food Market Inc main supplier (click here for Whole Food Market’s Import Trade Profile).

 Top Exporters of Bananas by Country

Ecuador, the fourth largest producer of bananas, is the world’s top exporter, consuming 43% of the world’s market. In 2009 alone Ecuador secured 6.66 billion dollars worth of banana sales abroad. Colombia, Ecuador’s closest neighboring country and the ninth largest producer, was the world’s second largest supplier of bananas, accounting for 25% of the world’s foreign banana market with a 3.8 billion dollar worth. Philippines is the only other country pulling in more than a billion dollars of banana sales per year, accounting for 19% of the world’s market.

World’s top banana exporters by country: Ecuador, Columbia, Philippines pie chart graph percentage 2009 dollar amount shipments annual

World’s Top Banana Importers

Ever wonder where all those bananas at the market come from? Well the United States is the world’s largest importer of bananas. In 2009 alone the United States spent 3.1 billion dollars on foreign bananas. United States bought 20% of all the world’s for-sale bananas. Other northern industrialized nations followed. Germany imported 12% of the available bananas, Italy 8%, Russia and Belgium 6% a piece, Canada and the Netherlands 5% a piece, France and the United Kingdom 4% each, and Japan 3%. Just these 10 countries make up 75% of the world’s banana buying market.

Seventy-five percent of the world’s import market bananas by country United States com trade pie chart Germany 2009 dollar amount graph

The United States receives 96% of its bananas from South America. This is not surprising since the strongest banana world growers and exporters are located there. Also notable is the relatively short distance from South America to the United States. The estimated 2010 value was 1.7 billion dollars of imported bananas from this region. More interestingly we can gain access to the top companies selling bananas to the United States. Using PIERS Prospects we can pull up the top 26 companies exporting bananas into the States. We can see that the largest company is Union De Bananeros Ecuatorianos Sa. We can view individual companies’ telephone numbers and address. Within the program individual company profiles also exist. Provided for your convenience is an excel data sheet filled with leads of companies. The top banana sellers exporting to the United States are all in this file (download here). This data set includes sales, phone numbers, number of employees, company presidents, etc.

Top foreign sellers of bananas companies by region value to United States imports data shipment waterborne value money sales list