Tag Archives: Trade Statistics

Understanding the Harmonized TARIFF System Classification of Products for Import-Export

The official language of international merchandise trade exists within a Harmonized System of product codes; “a tariff nomenclature (which) is an internationally standardized system of names and numbers for classifying traded products developed and maintained by the World Customs Organization (WCO)…  [used by] more than 200 countries, customs and economic unions, representing more than 98% of world trade.”

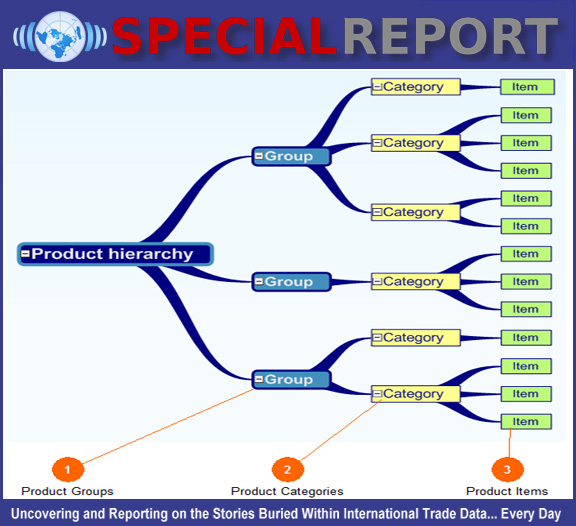
The HS (sometimes called HTS for Harmonized TARIFF System) is organized in 21 sections and 96 chapters. The 96 top-level two digit categories (let’s call them “parents”) form a hierarchical lineage containing over 1,000 four digit children and some 6,000 six digit grandchildren.  “To ensure harmonization, the contracting parties (countries) must employ all 4- and 6-digit provisions and the international rules and notes without deviation, but are free to adopt additional subcategories and notes.”

A familiar idiom states, “Give the devil his due”.  The primary reason behind the HTS system of product identification, besides providing a common reference point for trading purposes, is taxation.  It’s the all important middle “T” in HTS.  Although Tariffs & Duties can be applied to both imports and exports, “Tariffs are usually associated with protectionism, a government’s policy of controlling trade between nations to support the interests of its own citizens. For economic reasons, tariffs are usually imposed on imported goods.”

Each country further applies additional sub-categories beneath the universally agreed upon 6 digit HS provisions in order to track more precisely the commodities and products they are most interested in “protecting”; i.e. monitoring and taxing.  These subcategories (great-grandchildren, great-great grandchildren, etc.) can generate branches of 8, 10, 12 or more digits.  “The Harmonized Tariff Schedule of the United States (HTS) is the primary resource for determining tariff classifications for goods imported into the United States (and can also be used in place of Schedule B for classifying goods exported from the United States)”.  There are over 17,000 unique ten-digit HTS classification code numbers.

Example of the Harmonized TARIFF System

One of the very first tasks that many Trade Consultants undertake in working with a newbie importing or exporting company is to help them assign the appropriate HTS codes to their respective product(s).  Most U.S. companies don’t have a clue.  In China, I think they learn the HS system in elementary school along with English.  Improperly classified products are likely to have a very difficult journey through Customs and incur additional costs.

One of the biggest problems in the process of transforming trade data into trade intelligence is inherent in the HTS nomenclature.  It is extremely obtuse.  The descriptions are almost impossible to understand.  The classification “logic” varies from chapter to chapter, category to category.  The most commonly used term is the ever endearing and everlasting designation: NESOI.  No, it’s not a type of plastic, article of clothing or technological component.  It means, NOT Elsewhere Specified Or Indicated.  World-wide imports and exports of NESOI have experienced exponential growth during the last 10-20 years during the information age.

By and large it’s all a form of Trade Technocracy, a malady which I have spent a sizable portion of my tenure as a Trade Intelligence Professional attempting to remedy.

International Trade Data References: Global, U.S., State, Metro & Company Data

In addition to the primary TI providers much referred to within the articles published on World Trade Daily, there are a number of valuable statistical sources that are useful when trying to develop a complete picture of International Trade.  These include sources that provide Global, U.S., State and Metro trade statistics.  They include the following:

Beyond the resources referenced above, which are mostly places to get hard facts, data and charts, it still remains a matter of interpreting the data, making sense of it, seeing patterns, making observations, and “spicing” /dressing it up a bit with some Google research as well as your own intuition (based upon intelligence, knowledge and experience).

Some other interesting articles I ran across recently as an adjunct or primer to the above are the links below. They are particularly helpful when trying to prioritize which cities, companies, states to select from when conducting research and developing analyses.

Trade Statistics: Discovering Market Opportunities Through Research & Analysis

What can you do with Global Trade Flow Statistics?  What can the numbers tell you?  Think of it like getting to know a person.  Each person has a story.  Each product that is bought or sold has a story too.  The big picture of international trade is composed of many millions of individual stories woven together into a huge, ever-changing tapestry.  Global Trade Flow Statistics are like “vitals”.

When you go to a doctor, he/she checks weight, blood pressure, temperature, etc.  These pieces of data provide the foundation for understanding your particular situation.  After the preliminaries are completed, you will be asked additional questions in order to assess your individual condition.  Perhaps x-rays, blood tests or another specialist examination will be called for.  Each vital statistic is evaluated in combination and in context (with the aid of experts) in order to render a proper diagnosis and treatment plan.

Global Trade Flow Statistics (about what has been, is currently and what is expected to be bought or sold by a particular country of your respective product) are vital pieces of information. They not only establish a fundamental knowledge of the situation, but also provide the necessary clues about what other data is required. Collecting, comparing, analyzing and reporting this and accompanying data are called Market Research.

No would-be (intelligent) exporter or importer of products or raw materials should attempt to conduct business without it.  It would be similar to dispensing a prescription without a thorough examination.  You might guess right more times than not, particularly if you consider yourself to have “street smarts”, but the cost of not knowing what you don’t know can be considerable.

Statistical Analysis can provide snap shots from the front line of the "Trade War"

Many times, the most important information that can be gleaned from statistical analysis is more questions.  I remember stumbling upon a 10,000% jump in annual shipments of auto parts from the U.S. to an obscure African country.  Further investigation revealed that, to circumvent the trade embargo imposed upon South Africa, U.S. shipments were being rerouted through an adjacent nation.

Another anomaly I remember was the exponential increase in imports by the U.S. of Chilean Salmon.  Market research conducted for an entrepreneurial friend of mine, revealed that 98% of Chilean salmon shipments came into Miami, took several days to clear customs and then several more days to be trucked to destinations north.  His plan was to establish direct flights into Nashville, reroute distribution and save almost a week.  In the world of a fresh, perishable commodity like fish, that’s an eternity.

At CenTradeX, I developed dynamically generated reports that illustrated the trade balance (comparing exports with imports) for any particular product between any chosen trading partners (countries) over a 20 year period.  With 6,000 product categories and 200 countries that generated over 1,000,000 snapshots, it was easy to observe, if “trade war” is a metaphor you are comfortable with, exports representing money (green) and imports representing (red) how the U.S. has been faring, economically speaking, (soldier by soldier/product by product) with China over  time.

Global Trade Flow Statistics: Take a Look at the Big Picture

It all starts with the data.  Data is THE fundamental building block used in constructing Trade Intelligence.  Trade Intelligence, in one form or another, is the guide map used to navigate trillions of dollars of exchanges in goods and services by every year.  WorldTradeDaily.com is dedicated exclusively to the matter of Trade Intelligence.

Let’s take a look at Global Trade Flow Statistics particularly merchandise (versus services) trade.  First of all, it’s easy to forget when looking at the numbers, that beneath all the digits and commas are real people, companies, jobs, business relationships, political agendas, and the prosperity (or lack thereof) of countries and regions.

Specifically, Global Trade Flow Statistics, organized within the hierarchy of roughly 6,000 commonly used and agreed upon product (HS) codes, track the imports and exports between each of 200 countries. The respective governing (and taxing) authority for each government collects, aggregates and (usually through an associated entity) disseminates statistical information on their trade activities at least once per year.  Many, like the U.S. and Europe, release data monthly.

The numbers reflect the total import or export value for each of 6,000 (six digit HS) product categories, which of course is easily aggregated to the four-digit parent grouping (around 1,200) and the 90+ (two digit) grandparent classes.  They also document the number of units sold, whatever type unit, item, case, container, pallet, or barrel is being referred to.  Obviously, cost per unit can be derived from dividing the value by the number of units bought or sold.

You can obtain this information on virtually every country on the planet with a few exceptions. For instance, Taiwan is not officially recognized by the United Nations as a separate country for publication purposes.  You won’t find Palestine’s imports and exports either.  The U.S. releases trade flow statistics every month trailing around 45 days.  For handfuls of developing countries you may have to wait a year or two before you see trade figures.

Some countries maintain their own special rules for what they consider a documentable (and therefore reportable) export or import.  Of particular note are China and several Middle East countries.  China doesn’t report products manufactured and exported by foreign-owned companies as exports.  Therefore, you will quickly discover HUGE discrepancies between what China reports they export to –let’s say the U.S. -versus what the U.S. proclaims they import from China.

Consequently, the truth about burgeoning trade deficits and trade imbalance along with the associated political and economic bantering about such things, needs to be reviewed in the light of underlying definitions.  It is said, “Information is power”. Many of the specifics about trade transactions are carefully guarded government secrets.  China, Inc. is closer to true than not.

The reality is that International Trade is the indisputable foundation for economic growth and prosperity.  Global Trade Flow Statistics aren’t just obtuse and academic, they are historically relevant, currently pertinent and provide clues to future opportunities and trends that can inform and prosper the wise.

Special Report: Trade Research. Finding the HS Code & Getting Some Data

While taking a much-needed vacation in the Dominican Republic, I ended up being “commissioned” by a fellow vacationer to conduct a research study into the scooter (little motorcycles under 50cc) market.  Although my girlfriend and I dispensed with computers, cell phones and all other electronics, I guess it’s harder to totally turn off the business side of the brain.  I do confess though that it is somewhat recreational to engage in entrepreneurial deliberations over excessive inebriation.  Anyway, I thought to share some steps that can help any newbie researcher to analyze a product for import.  We’ll start with getting some basic data.

Step One: In order to retrieve data about a product, you must find the appropriate harmonized classification for that item.  The Harmonized code for Mopeds is 871110. Remember, 6 digits is the most specificity you can uniformly retrieve for either exports or imports.  Beyond 6 digits there are variations from country to country on classification.  You can try to find the code via Google. Typing in the words: “Harmonized Code, scooter, under 50cc” brings back a set a results from which it is easy to lift the harmonized code.

You can also try a more formal approach such as visiting the U.S. Census Bureau tariff search site.  The words: scooter or moped return a screen that asks the user to choose between the following categories:

  • <= 50 cc (871110)
  • > 50 and <= 250 cc (871120)
  • > 250 and <= 500 cc (871130)
  • > 500 and <= 800 cc (871140)
  • > 800 cc (871150)

The International Trade Commission offers a comprehensive catalog by which users can drill down into the fine details of a particular harmonized code by chapter and verse.

To continue, each of the 6,000 six digit harmonized product classifications are organized within a parent – child – grandchild hierarchy.  Each “family” has its own set of rules and criteria under which subclassifications are created.  In the case of motorcycles 8711, its parent – the grandfather of the family – is 87 Vehicles.  Motorcycle’s offspring are organized by size from the littlest of the brood: 87.11.10 (equal to or less than 50cc) to big  bikes: 87.11.50 (the hunkiest of the gang).  Although not displayed in the Census results, there is another grandchild, which is also in most of the families designated by the xx.xx.90 designation: 871190: other.

Step Two: Getting the export values from Census is simple. Basically we export about $24-25 million in scooters (mopeds) annually.

U.S. Scooters Exports

Step Three: Getting the import values, through the ITC DataWeb interface is a real pain. You first have to register and then go through an agonizing process to define and retrieve a report.  UGH! So painful and laborious. It’s free at least.

Step Four: So, what does the data tell us?  Well, for one thing scooter imports dropped drastically from 2008 to 2009 – by 60%, then by another 50% between 2009 to 2010. Wow. Plummeting from $140 million to $29 million is rather significant.  YTD (January through May 2010-2011) reveals that imports are rebounding though, seeing almost a 400% increase over the same period last year.

Just so happens that our friends over at Zepol have produced a much friendlier, easier to get and easier tounderstand recap. Click this link for an updated chart.

Zepol depiction of Scooter imports and exports

Zepol’s rendition beautifully illustrates that the increase in imports gathered steam in recent months.  It also goes to show that the instruments offered for free by the U.S. Government are world’s behind those available through reputable TI providers.

Suppliers of Global Trade Flow Statistics: United Nations, GTIS & WISER

The most accessible and inexpensive source for global trade flow statistics is the United Nations.  Through their COMTRADE database, users are free to search for and download data on the imports and exports of products classified in over 6,000 categories (in the Harmonized System) between almost 200 reporting countries.  The same data is also available in other product classification systems (like the ISIC and SITC) for some countries.

The statistics are gathered and disseminated, as they are received, on an annual basis.  With some countries the time lag is only several months following year-end, while others take a year or two to report.  The dataset depicts trade value, number of units bought or sold and trading partner (corresponding country) for each given year.  The U.N. maintains (and makes available to the public) historic records of each country’s trade activity up to several decades back.

Users are limited to the number of records they are able to download at one time without cost.  However, the U.N. offers an inexpensive paid subscription option that provides unlimited search and download capability of all their trade databases.  The corresponding interface allows users to save their search queries for later use as well as set up alerts with automatic download of updated data.

U.N. ComTrade Database is usually the first place to go for Global Trade Statistics.

The only negatives are the lack of specificity and recency. The U.N. data only reflects aggregated annualized figures. Updates are sometimes spotty and infrequent. The data contains only the basest attributes of value, flow (import or export) partner (country) and unit of measure as well as other derivative statistical information therein contained (category sums, cost-per-unit, etc).

If you want greater specificity and frequency, you will need to turn to other sources.  GTIS (Global Trade Information Services) and WISER Trade (World Institute for Strategic Economic Research)  (They used to be called MISER.) These sources have gone through the sometimes complicated processes of obtaining trade data directly from the individual countries as soon as it is made available – sometimes monthly.  The countries where they don’t get “special” data, they fill in with U.N. /ComTrade data, FYI.

Of course, individuals and organizations have the option of apprehending the same information (that GTIS or WISER sells) fairly easily, at least on 50% -60% of the countries.  U.S. Census sells import/export merchandise trade flow statistics for a couple hundred dollars.  EuroStat, releases similar information at no or low cost.  Obtaining Japan trade data is a simple matter as well.  Therefore, 80% of the worldwide merchandise trade, conducted by the countries referenced above, can be obtained and analyzed on a monthly basis at minimal cost.

What one abandons by such efforts are the technologies and convenient user search and reporting tools that have been developed by GTIS, WISER and several other Trade Intelligence providers, many of which are finally integrating aspects of Global Trade Flow Statistics into their particular product interfaces.  On the other hand, for maximum flexibility, versatility and veracity in utilizing data for specific analyses, reporting and applications, one may be best served by going directly to the sources.

U.S. Census Bureau – Division of Foreign Trade (USCB-FT) Offers Many Statistical Products

The best source for U.S. Trade flow statistics, if you want them in the purest, rawest form, is the U.S. Census Bureau – Division of Foreign Trade (USCB-FT).  Trade Statistics are the bread and butter of Trade Intelligence.  Several TI Providers, namely GTIS and Wiser Trade, have made a business from superimposing their particular brand of searching/reporting engine atop of said data, but for the greatest versatility and analytical capability, one is best to start at the source.

USCB-FT collects, aggregates, slices, dices and disseminates data collected on and about U.S. international import and export transactions.  As they state, “The United States Code, Title 13, requires this program. Participation is mandatory. The Treasury Department assists in the conduct of this program.”  Yup, if you’re going to buy or sell anything valued at $2,000 (imports) or $2,500 (exports) or more overseas you must pay homage to the Feds. Paperwork makes the world go around.

In whatever form the resulting (aggregated) transactional trade data is presented, USCB-FT takes special care to prevent anyone from being able to link the statistics to the underlying companies. It is one, if not THE, primary objective of your neighborhood Trade Intelligence Supplier to disaggregate this data and reconnect the dots obscured by the U.S. Government. It takes sophisticated technology, other data sources, lots of hard work, clever sleuthing and a bit of luck, but it can be done. But I do digress.

Back to basics. USCB-FT serves up a yummy variety of statistical delicacies in several schedules and venues (available for either imports or exports) including:

The above list of Data are compiled in terms of commodity classification, quantities, values, shipping weights, methods of transportation (air or vessel), customs district, customs port, country of origin (or destination).

  • In the case of exports – state of (movement) origin and whether contents are domestic goods or re-exports.
  • In the case of imports – market share, unit prices, import charges and duties collected.
Back in the day, hungry recipients would have to pace impatiently awaiting the release and delivery of their monthly data dinner.  Now, subscribers can simply download their respective selection(s) immediately and directly from the U.S. Census data cafe.  Why trade statistics are important, to what ends this data is employed, understanding the intricacies of information and how it can be combined with other data sources to provide a more complete picture of world trade shall be left for another post at another time.

Pay With Bitcoin

WISER: World Institute for Strategic Economic Research- Statistical Data Source, Part 2

Continued from Part 1

The WISERTrade Database Cheat Sheets

WISERTrade Databases include data on the following:

  • U.S. State Exports and Imports by HS, NAICS, SIC, Port (which is nice when looking for long term information, beyond HS code)
  • U.S. Imports and Exports by District and Port
  • 27 EU Countries Imports/Exports by HS
  • Detailed Reporting on the Following:
    • Canadian Province Imports/Exports by HS
    • Chinese Province Imports/Exports by HS
    • Taiwanese Imports/Exports by HS
    • Japanese Imports/Exports by HS
    • 184 UN Countries Imports by HS
    • Kompass database of 2.8 million companies

State Imports and Exports:

Data is organized according to two main subsets: extent of data (e.g. from annually from 1996) and by categories such as country (exporting to/importing from), value, weights by method of transportation, etc. Here’s the Cheat Sheet:

State Exports and Imports by 6-Digit HS Commodity:

By: Data Available from:
Country Value Weights by Method of Transportation
  • Exports:
    • Annual: from 1996
    • Monthly: from January 2006 to present
    • Imports: annual from 2008 to 2009

State Exports and Imports by 3 or 4 Digit NAICS Industry:

By: Data Available from:
Country Origin of Movement Exporter Location Series Value and Weights by Method of Transportation
  • Annual Data from:
    • 3 Digit: 1997
    • 4 Digit: 2002
    • Quarterly Data from:
      • 3 Digit: Quarter I 1997
      • 4 Digit: Quarter 1 2002
      • Monthly from 2006 to present (EXPORTS)
      • Annual from 2008-2009 (IMPORTS)

State Exports by 2-Digit  SIC

By: Data Available from:
Country Origin of Movement Exporter Location Series Value and Weights by Method of Transportation Annual and Quarterly Data from: 1988-2000 (No longer being updated by US Census)

State Imports by Port

By: Data Available from:
Exit by Country Value and Weights by Method of Transportation Annual: 1997Quarterly: Quarter 1 2001 to Present

U.S. Exports and Imports:

U.S. Exports and Imports of commodities are organized into two categories: by 10-digit HS code and by Port.

U.S. Exports/Imports by 10-Digit HS Code

By: Data Available from:
Customs district of exit/entry Country Total Value Units Unit Value Value and Weights by Method of Transportation Annual: 1998 to PresentMonthly: January 2006 to Present

U.S. Exports/Imports by Port

By: Data Available from:
6-Digit HS CodeCountry Annual: 2003 to PresentMonthly: January 2006 to Present

World Exports and Imports:

World Imports and Exports: WISERTrade provides detailed information on the following countries using the codes upwards of 8-digits, except for the broad United Nations (184 countries) category. Data for the world imports and exports is divided among various subsets, the two categories that each country shares are partner country and value in U.S. dollars.

European Union Imports/Exports

By: Data Available from:
8-Digit HS Commodity Value in Euros Weight Units Unit Value Annual: 1998 to PresentMonthly: January 2006 to Present

Canadian Imports/Exports

By: Data Available from:
8 and 10 Digit HS Commodity Province of Origin/Exit U.S. State of origin/destination Value in Canadian dollars Units Unit ValueMethod of TransportationDomestic/Foreign Total (Exports) Annual: 2002 to PresentMonthly: 2006 to Present

Japanese Imports/Exports

By: Data Available from:
9-Digit HS Commodity Value in Yen Annual: 1998 to PresentMonthly: 2006 to Present

Chinese Imports/Exports

By: Data Available from:
8-Digit HS Commodity Province of Origin/Destination Units Unit Value Method of Transportation Annual: 2002 to PresentMonthly: 2006 to Present

United Nations (184 Countries) Imports

By: Data Available from:
6-Digit Commodity Annual: 2005 to Present

Taiwanese Imports/Exports

By: Data Available from:
11-Digit HS Commodity Port of Exit/Entry Units Unit Value Method of Transportation Annual: 2003 to PresentMonthly: 2006 to Present

WISER: World Institute for Strategic Economic Research- Statistical Data Source, Part 1

WISER: Tailored for the User

Formed in July 2004, the World Institute for Strategic Economic Research, WISER, sought to continue the work of its predecessor, MISER—Massachussetts Institute for Strategic Economic Research in the field of international trade data.

Another website that offers trade statistics, right? There are quite a few of them out there, so which ones are worth the effort and your dollars? Hopefully this review will help you figure out if WISER is a good fit for your needs.

WISER (MISER) was one of the first Business and Industry Data Centers to focus especially on foreign trade statistics and through various developments has become one of the leading providers of U.S. and state level trade statistics.

WISER boasts an extensive international trade database, consisting of the following categories:

  • Four U.S. State Level Export Series
  • U.S. Exports and Imports by Customs Districts and by Individual Port
  • EU Trade Statistics
  • Candadian Trade Statistics
  • Japanese Trade Statistics

Other WISERTrade benefits include:

  • Instant access to all data updates
  • Data coverage over long time series (primarily HS coding—less than 20 years, SIC—from 1988, and SITC—from 1997)
  • Standard and custom U.S. and world regions
  • Customized Industry/Commodity Lists
  • Drilldowns
  • Dashboard Graphics (charts, graphs, tables, etc.)
  • PDF, MS-Word, spreadsheet and text outputs
  • Mapping

WISER data is derived from only official sources, according to customer service representative Jack, such as the U.S. Census Bureau, government customs agencies, and United Nations database. Data from WISER is from “legitimate sources, no third parties here.” Dating back to 1988 until present day, many of the reports offer both annual and monthly data and can be exported into various dashboard graphics (charts, graphs, tables).

Though only available currently in English, Jack, the WISER customer service representative was very honest in stating where WISER falls on the totem pole of foreign statistic databases. UNComtrade’s data is on WISERTrade, however Global Trade Institute may come in different languages and be more complete, but not without a price passed on to you. Jack noted that subscribers are not allowed to download batches of data, but only limited amounts. However, as Jack described, there are options that allow you to batch your order at a price complete with computer software allowing you to extract the data.

Offered in a variety of formats, WISERTrade grants immediate access to comprehensive and timely U.S. trade databases. WiserTrade offers standard and customized statistical reports  and data files sent by fax or e-mail.

Okay, all of this information is great, but tell me the bottom line, right? How much do licenses cost? Well, it really depends on how many countries you need, as there are different licenses for different users. It is really tailored to the user, the amount you need, whether you want a monthly or quarterly subscription, or perhaps on an as-needed basis. Contact WISER for more information specific to your needs. Here are a couple numbers: consultant licenses range from $3,000 to $5,000 based on how many countries, and for personal use for projects or research is about $1,000.

Still not sold? Well, you can try it out for yourself and fiddle around with the system itself, just shoot customer service an e-mail and ask for an online demo, but you have to request it.

“WISERTrade is an invaluable resource for businesses, trade service providers, libraries, universities and other trade data users, providing the most extensive U.S. and World trade database available online.”

GTIS Global Trade Information Services: “The World’s Data at Your Fingertips” Part 2

Continued from part 1.

“The Whizmachine” Global Trade Atlas

Ok, so you got  a broad picture about what GTIS is, what Global Trade Atlas is, and who’s using it, but you want the details!!! Okay, well here we go…

Global Trade Atlas is an online trade data system that “offers a unique perspective for viewing the world’s merchandise and trade statistics allowing users to view world trade flows for products using the latest import/export data from official sources of more than 80 countries. Russell, from the GTIS customer service team stated that one of the “ways we hope to develop is by updating database functionalities, and hopefully adding new countries. However, for now we only get our data directly from customs agencies and the official government.” GTA primarily uses the Harmonized Code (2-digit, 4-digit, 6-digit, and further detailed as provided by country) allowing users to determine the specificity of their searches. When asked why there are no provisions for other codes, such as NAICS, SIC, SITC, etc., Russell explained that, “the Harmonized code is the most detailed of the codes, and some of them are no longer being used. We have the capabilities for translating some of these codes, but we are primarily HS code.” By default, however the “history” of this data cannot really extend beyond about twenty years, so for longer term data, you may need to look elsewhere.

Upon the features of the World Trade Atlas, Global Trade Atlas has also added the “Extra Data Field Module,” which allows users to sift through data by reporting country by region or state, mode of transport, port or customs district, or re-exports and domestic exports. The data displays value, quantity and average unit price, import or export market share, and percentage change.

Okay, all good things, but what if I’m looking for a specific commodity for multiple countries, or a certain product group, or maybe all the trade of one or more particular countries, can GTA help me? YES! GTA users can choose to subscribe to all of the above and then determine whether they want to be updated monthly, quarterly, or annually.

You can use Global Trade Atlas to:

  • Track imports and exports of a product on a global scale on one screen
  • Identify new markets and competing products
  • Analyze trends in the market by viewing historical data
  • Find the existing market share of each product by country

Other features of Global Trade Atlas include:

  • Ability to download any screen or selected selection directly into Microsoft Excel or Word
  • Use the interface in multiple languages
  • Find the HS product via keyword or number
  • Derive import/export data for countries not available in the GTA

Bottom line, right? Well, subscription fees are based upon your needs and these three factors

  • Number of reporting countries
  • Number of 6-digit commodity codes
  • Frequency of data updates per year

Unfortunately, I was not able to obtain actual numbers since each of these criteria are important in determining the subscription cost. Contact GTIS Customer Service for specific pricing. Subscriptions are for a full calendar (12 months) year and if you want to experiment with the program before purchasing you may ask for a trial…but you have to ask!

GTIS continues to look for new ways to promote a better understanding of global economic development, with its innovative software, a professional staff with strong international trade backgrounds, and experienced professionals in the trade field with the latest technology.

GTIS Global Trade Information Services: “The World’s Data at Your Fingertips” Part 1

There’s Eurostat, International Trade Administration, WISER, and UNComtrade among other sources for foreign statistics. Well, here is one more, GTIS, the Global Trade Information Services.

Established in 1993 on the east coast, GTIS was “established to promote a better understanding of global economic development.” Through their understanding in the increasing importance of world trade and the development of computer technology, GTIS has produced their own software solution for trade data and analysis. Currently serving clients in over 250 cities and 50 countries worldwide, GTIS is recognized as a leading supplier of international merchandise trade data.” The Financial Times exclaims that it is, “ the world’s data at your fingertips.”

World Trade Atlas was the first software developed by GTIS revolutionizing the way trade data was used. The World Trade Atlas (WTA) allows quick and easy browsing through each country’s data to determine the competitiveness of the world market for certain commodities or products. WTA produces tables that trade analysts would need to spend months building. Export Today sings its praises, “Elegant, quick and easy…I searched a mountain of trade data in seconds.”

Succeeding the World Trade Atlas, is the Global Trade Atlas, GTIS’s newest software that was built off of WTA’s best features, while also accommodating the extra data fields (e.g. U.S. State, Port and Customs District data). GTA allows users to see the bigger picture instead of a country by country basis. A bonus feature of GTA is the ability to create a model for a commodity and show all exports or all imports worldwide on one screen. “Trade analysts can determine more accurately market shares of world trade data for a particular commodity.” Though GTIS only obtains data from reliable sources, such as government or customs agencies, users can estimate import or export trade of a country with unreliable data by using reliable trade data of other countries. For example, if a user was looking for information on Nigerian imports and exports and the data was deemed unreliable, the user could estimate what the trade statistics were by viewing other countries who had reported importing or exporting to Nigeria. Database Magazine, says that “World Trade Atlas provides a different and better approach to retrieving trade data.”

The team at GTIS’s Global Trade Atlas work out all the details so that clients can focus more on analyzing the data and less about the logistics concerning it. GTIS is constantly working to create a system that is not only up to date and comprehensive, but also easy to navigate, which is a huge plus considering how much data can be gained from one simple request. Publishing monthly official government trade statistics for more than 80 countries, representing close to 100 percent of world trade, GTIS has earned a reputation of reliability, efficiency, and service (something I can personally attest to).

Do you fall in any of these categories? If you do, your competitors may be already using GTA:

  • Multinational companies
  • Research organizations
  • Consulting firms
  • Industry associations
  • Government agencies
  • Financial institutions

Check back tomorrow for Part 2.

International Trade Administration; Part 3: Sponsored Programs & Activities

In addition to providing information about trade, data and analysis, ITA also supports a variety of programs, summarized here.

Advisory Committees: A public-private partnership managed by the U.S. Department of Commerce and Office of U.S. Trade Representative (USTR), where business professionals can partake in formulating U.S. trade policy. The Industry Trade Advisory Committees are the primary link between industry and the U.S. government. The government relies on trade advisors to identify barriers, provide advice on key objectives and bargaining positions on trade negotiations and other trade related policy matters.

Afghanistan Investment and Reconstruction Task Force (AIRTF): AIRTF was established by the Department of Commerce to provide information and counseling to companies interested in doing business in Afghanistan. AIRTF works closely with other commerce office, the U.S. Embassy in Kabul, other U.S. government agencies, Afghan government agencies, and international organizations to coordinate activities in support of Afghan economic development. The focus is to development the private sector through the improvement of a market conducive to trade, investment and private sector growth. AIRTF offers information on business opportunities, market information, tenders, and trade missions (the next one is in February, register by January 3, 2012).

America’s Competitiveness Forum: provides an opportunity for business to business and business to government discussions yielding practical actions that can improve competitiveness and economic prosperity in the Americas.

Good Governance: a program promoting rule of law for business. Good Governance uses country-tailored approaches to support local efforts by private sector organizations working to combat corruption. Good Governance works to ensure that U.S. firms have equal opportunity to complete in a transparent business environment.

InvestAmerica (SelectUSA): U.S. government wide effort to encourage, facilitate, and accelerate business investment in the U.S. by domestic and foreign firms.

Iraq Investment and Reconstruction Task Force: established by the Department of Commerce, this program also has the same intentions and process as the AIRTF (see above). Iraqi Trade Delegations will be present for various conferences and shows in early 2012 in Las Vegas (Nevada), Istanbul (Turkey), Chicago (Illinois), and Houston (Texas).

Market Development Cooperator Program: awards include financial and technical assistance from the ITA to support projects that enhance the global competitiveness of U.S. industries. These awards establish partnerships between ITA and non-profit industry groups.

SABIT (Special American Business Internship Training Program): creates a forum for business development and technical assistance. It helps American organizations create new relationships and strengthen existing ties with Eurasian partners and customers from each of the former Soviet republics.

Safe Harbor: intended for organizations (within the EU or U.S.) that store customer data; it was designed to prevent accidental information disclosure or loss.

Stopfakes: resource about protecting intellectual property rights.

Strategic Partnership Program: enables increased export opportunities through joint outreach and education to small and medium sized U.S. businesses. Its mission is to expand the U.S. export base through innovative public-private sector partnerships.

Sustainable Business (Sustainable Manufacturing Initiative): launched by Commerce’s Manufacturing and Services. Goals include identifying U.S. industry’s most pressing sustainable manufacturing challenges, and coordinating public and private sector efforts to address these challenges.

International Trade Administration, Part 2: Competition, Numbers, and Analysis

Competitiveness: ITA advances policies and strategies that stimulate innovation and advancement, enhance economic growth, and support the U.S. manufacturing and services industry. They represent U.S. industry’s commercial interests in trade negotiations, bilateral and multilateral discussions, and in policymaking.

Competitiveness Resources from ITA

Industry Analysis is provided by the office of Manufacturing and Services. Industry analysis provides information and analysis regarding issues that affect U.S. industry competitiveness. Their services range from evaluating the possible effects of U.S. government regulations and domestic policies on industries to providing trade and industry data supporting the development of national economic policies.

STATISTICS:

In terms of Statistics, there are a few options. Users have the ability to select from State Imports, which is also broken into three categories (1) Global Patterns of State’s Imports (e.g. imports to California from each country) (2) State by State Imports from a Selected Market (e.g. imports to France to each state) (3) Import Product Profile from a Selected Market (e.g. products to Minnesota from Iceland).

The Statistics section of ITA also has links to Trade Policy Information System, but it is only available within the Federal government, or through a Federal agency account or grant or contract from a Federal agency. Trade Policy Information System data has been used to develop trade policy, trade implementation, and trade district analysis, the publication reports, and export promotion planning. Under the Statistics section, there are several PDFs available concerning Top Trade Partners, U.S. Trade Overview Presentation, Services Trade 2010, and Free trade Agreement Trade Tables.

Under the Trade Stats Express function, there are two broad categories that are additionally broken down. The first option is National Trade Data (U.S. merchandise exports and imports, trade balances) which is further categorized into (1) Global Patterns of U.S. Merchandise Trade (e.g. U.S. steel imports and exports for all countries) and (2) Product Profiles of U.S. Merchandise Trade with a Selected Market (e.g. all products traded between the U.S. and Mexico), where trade partners can be refined to reflect individual countries, geographic regions, or trading and economic regions. The second is State Exports which is broken into similar categories as State Imports mentioned above.

All data searches and queries have the date range of 1989 to 2010 and a quarterly data of up to five years. Additional data options are dollar or percentage changes. Map displays 2005 to 2010, and the NAICS, HS, or SITC classifications can be used, but users may also search by product list, code, or search, giving every user plenty of options.

INDUSTRY SPECIFICS: can be gathered through the provided links:

Guest Blog: UN Comtrade: 200 Countries, 48 Years, 6,000 Products – 1 Website

UN Comtrade, the United Nations Commodity Trade Statistics Database, is one of the most comprehensive trade databases. It provides detailed import and export statistics with over 1.7 billion records and over 170 reporting countries. These statistics are classified according to the SITC (standard international trade classification), Harmonized System, and Broad Economic Categories, and are used for, among other things, determining the importance of commodities in terms of world trade and trade negotiations.

The database includes the following topics:

  • Food and live animals
  • Beverages and tobacco
  • Crude materials, inedible, except fuels
  • Mineral fuels, lubricants and related materials
  • Animal and vegetable oils, fats and waxes
  • Chemicals and related products
  • Manufactured goods classified chiefly by material
  • Machinery and transport equipment
  • Miscellaneous manufactured articles
  • Commodities and transactions not classified elsewhere in the SITC

UN Comtrade Database

The values of these goods are converted to U.S. dollars, while their quantities are measured by the metric system. The database takes the current classification/revision and converts it to its earliest classification to enable users to gather long-time series results. It is important to know into which classification the commodity you are looking for will fall. Some will only be available in the newer classifications such as HS2002 and commodities such as PCs and mobile phones. Overwhelming, right? Don’t worry, there are step by step guides listed in the First Time user guide that can help you navigate your way through the database.

The nice thing about the UN Comtrade website is that all users have free access to it and have a download limit of 50,000 pages per data query. There is no limit to how many data queries a user can do. Additionally, all users can use Comtrade Explorer, where you get an instant overview based off of a country name and commodity. You can refine from there. To explain methodology and how these statistics were calculated, the section UN Comtrade Knowledge Base explains the database’s functionalities, concepts behind the data, and why imports and export differ. For questions concerning how-to’s and reviews from other users, you can utilize the UN Comtrade Community Forum. Need answers now? Get instant online support with the live help feature.

A wealth of information at the touch of your fingertips, all for the low price of FREE!

UN Comtrade

If you want to download more data, you can sign up for premium access. (There are special categories that do not have a 50,000 page download limit, including registered institutional users: academic institutions, governmental and non-governmental agencies, NGOs, and some developing countries listed on the IDA list). However premium access members can not only download more data, but they may also save queries on the system, make and save country or commodity groups on the system, customize the download layout or schedule execution of certain queries at regular intervals. You may seek premium access on the UN Publication website or via e-mail: subscriptions@un.org.